Problem
I saw your recent tip on Getting Started with Power BI Designer and now I want to find out some of the functionality related to the Power BI Desktop query tools. What functionality is available? What data sources can I connect to? How can I manipulate the data? Can I modify the queries directly?
Solution
In a previous tip, Getting Started with Power BI Desktop, we described in detail the new Power BI Desktop (AKA Power BI Designer) that Microsoft has added to the Power BI tool set. Of course just as the tip was published, Microsoft renamed the tool from Power BI Designer to Power BI Desktop (PBID). Even so, the basics of the tool and the details in the tip still apply. Getting the designer is easy as the Power BI Desktop is available for download at: https://powerbi.microsoft.com/downloads. The current edition of the software is available free of charge and Microsoft has indicated that the tool will continue to be free. Of course that could change. Furthermore to publish the PBID reports to the web, you must have an account setup on the Power BI site. Before I go too far I need to warn you that the tool is still in its early stages. Sure it works well from my testing, but features are being added and removed every month. Be sure you temper any move to production with the fact the tool set may not scale as anticipated or may plainly just not work. OK….. So it may not work. Enough said. With all these changes and updates, Microsoft is currently releasing an updated preview about once per month. You can see the latest version information on the Microsoft Power BI Support page at: https://support.powerbi.com/knowledgebase/articles/489224-what-s-new-in-the-latest-power-bi-designer-preview.
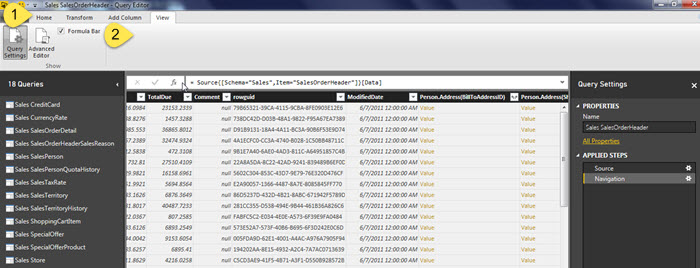
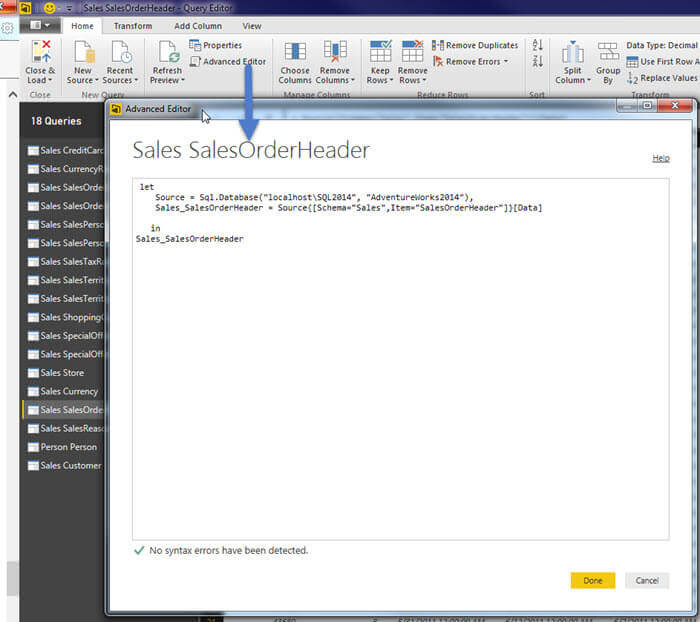
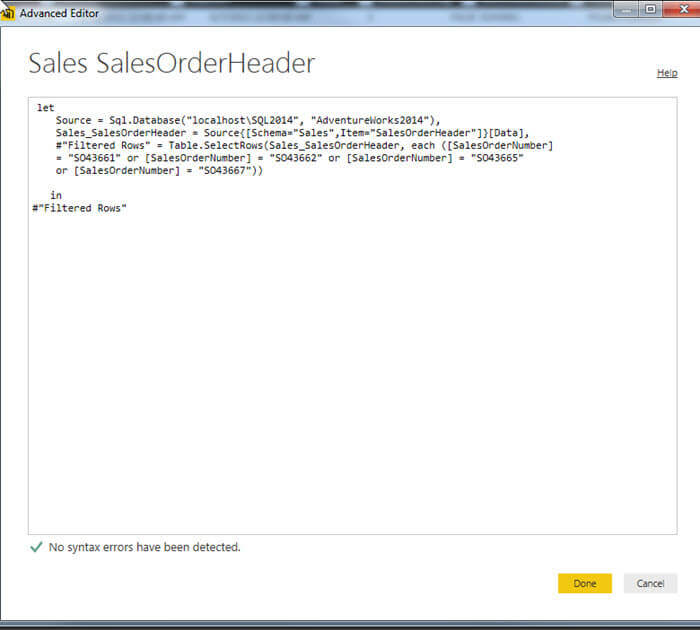
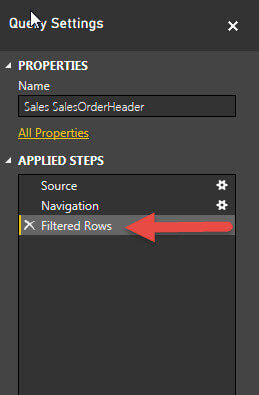
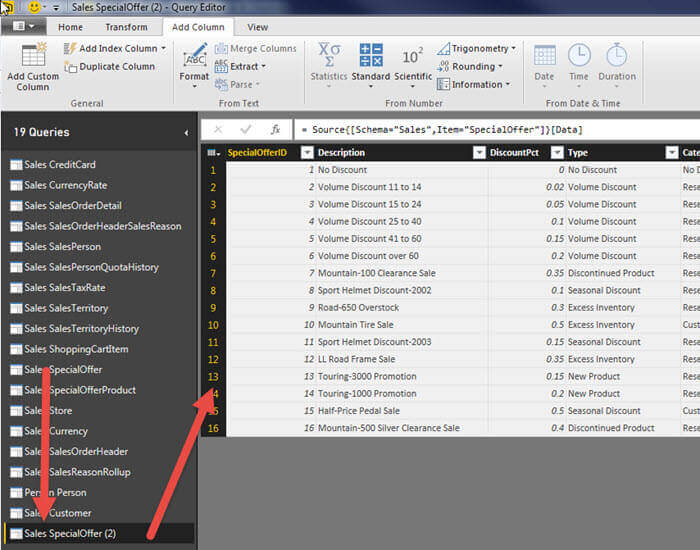
Querying data with Power BI Desktop
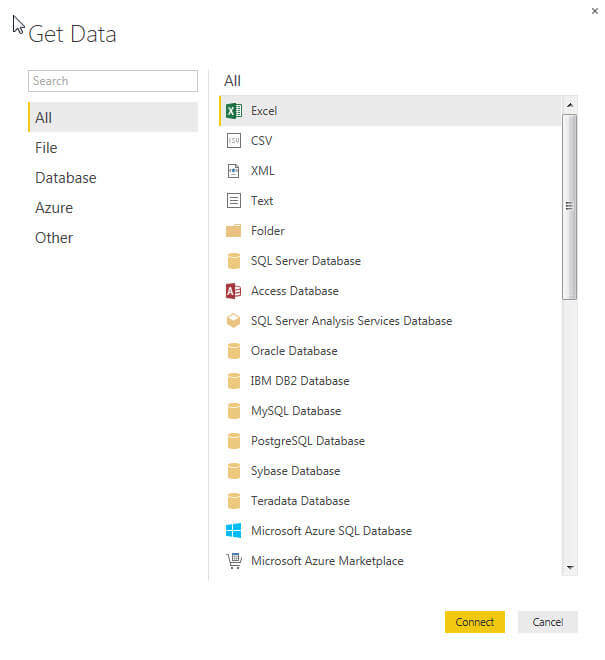
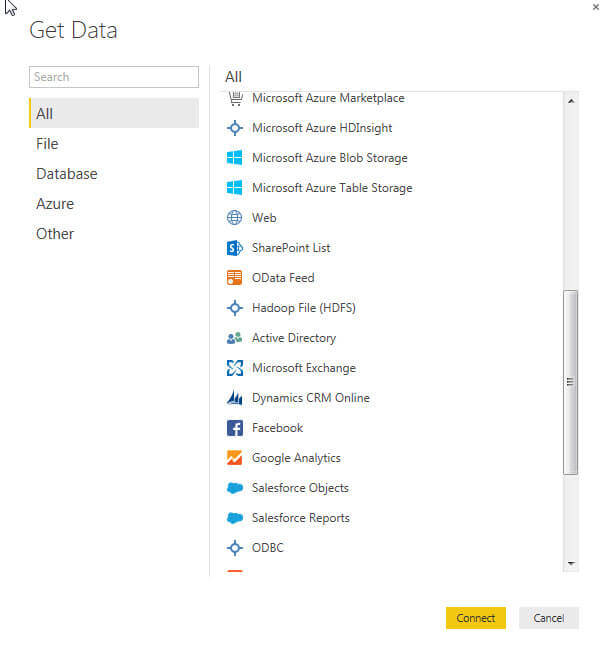
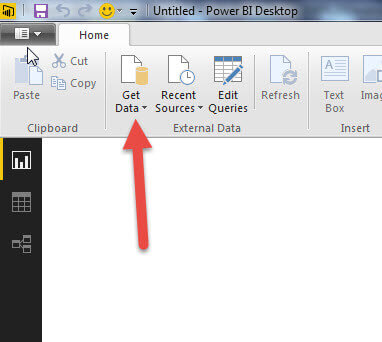
When you open PBID, the start screen, as shown below, allows you to start the query process via clicking on Get Data. Alternately, if you bypass the start screen, you can click on the Get Data button in the ribbon.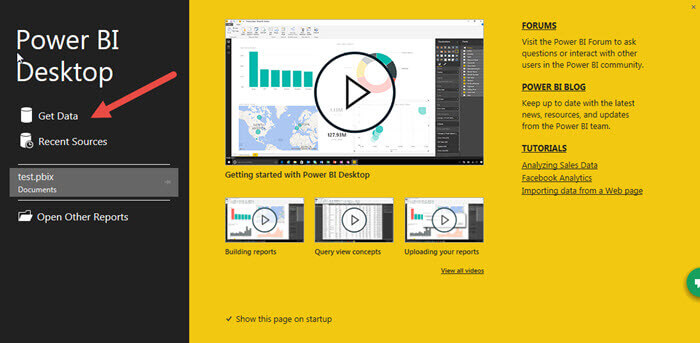
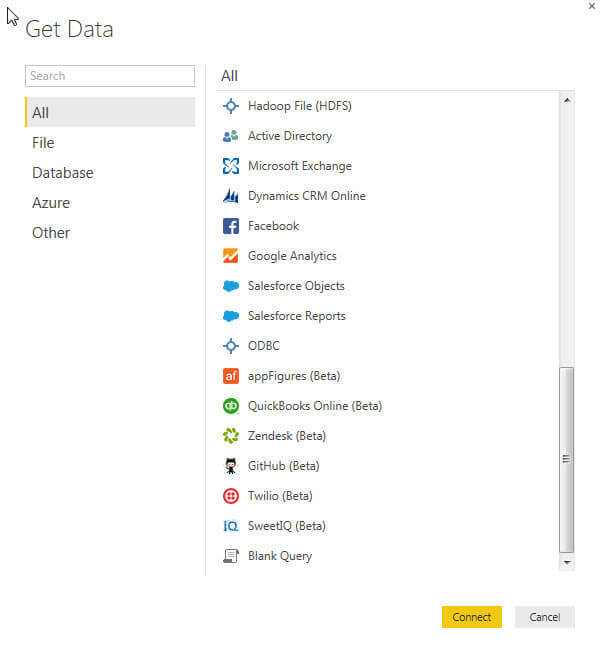
Both options open the data source selection screen. As you can see from the three illustrations below, the data source list is both long and growing each month. You will note some are still in beta mode, some, like SQL Server, Excel, and Access are “old stand bys”, while others I find to be particularly noteworthy including:
- Folder- This source allows you to examine the meta data of all the files and sub-folders in a folder
- Microsoft Azure MarketPlace, Azure SQL Database, Azure HDInsights, Azure Blob Storage, Azure Table storage – These sources provide a tight integration with Azure based services
- Web – Web based html tables can be scraped to get data
- SharePoint Lists – SharePoint lists data can be extracted from a SharePoint site
- Hadoop – Allows for easy retrieval of Hadoop based data structures
- Google Analytics – Surprising to me is the availability of Google Analytics as a data source
- SalesForce Objects and Reports – Opens up access to SalesForm CRM data and reports
- ODBC – If all else fails, hopefully a data source allows for ODBC based connections
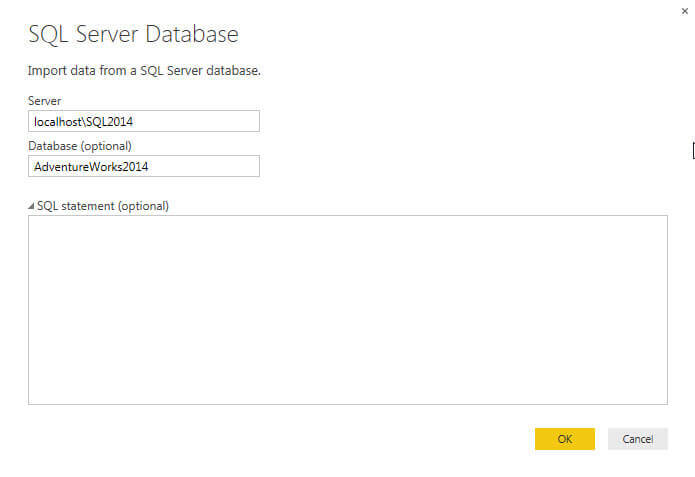
You need to be aware that many of these data sources will require you to know and setup the connection string details without much assistance from a fully automated wizard. Some of the sources provide more details than others. Be sure you know the pertinent details to setup a connection (server and URL names / addresses, ports, databases names, user ids, passwords, etc.).