Problem
Our applications are experiencing numerous SQL Server performance bottlenecks, but we are unable to pinpoint the issues. Our DBAs need deep insight into the application performance. We believe there are specific SQL Server queries that are causing the issues. How can we determine if the SQL query optimization issues are related to locking, deadlocking, a particular wait stat, indexing, statistics, working with large tables, caching, lookups, table scans or something else in the execution plan? We need to begin performance tuning by optimizing our running queries in real time. We also need to investigate recent issues with an affordable solution. How can we resolve these database performance issues quickly?
Solution
As much as SQL Server has matured over the last few decades as an enterprise relational database management system and community members are better educated on how to design, develop and deploy database applications, there comes a time when more of an advanced tool is needed to focus on SQL query optimization techniques. One tool that I would like to introduce is SQLGrease. This solution has been built from the ground up for SQL Server. This tool includes closely tied functionality and terminology to native SQL Server objects. DBAs can use data from SQLGrease to review Query Hashes, SQL Handles, Wait Categories, SQL Server native wait name and SQL Server Query Store ID’s. Let’s see how SQLGrease is optimizing SQL queries to improve the user experience.

Getting Started with SQL Query Optimization with SQLGrease
SQLGrease can be considered more of an in-depth SQL query optimization tool. Functionality includes real time and historical data to solve complex performance issues. The product’s goal is to quickly identify the SQL code causing the performance problem in great detail to start troubleshooting. SQLGrease is priced based on a monthly or yearly subscription model (including a free option). SQL Server 2008 to 2025 are supported versions. SQLGrease also supports SQL Server in public clouds – Amazon EC2, Amazon RDS, Azure Hosted VMs, Azure Managed Instance and Azure SQL DB. SQLGrease is also popular for hosting companies, corporate data centers and SAAS organizations in the SMB market. As a cloud based performance solution, SQLGrease offers full parity functionality across all cloud and on-premises versions of SQL Server. This consistency simplifies troubleshooting and ensures equal comparisons can be made across environments running on Windows or Linux.
In addition, as a completely cloud based product, SQLGrease requires no additional SQL Server \ Windows licensing or hardware is required to begin optimizing your SQL Server queries. All monitoring is performed with a simple collector installed on your network and data is stored in a performance warehouse in Azure. The Collector is a Windows Service that connects to your SQL Server instances with VIEW SERVER STATE permissions (not SA or DBO) and sanitizes your query text, execution plans, deadlock graphs, etc. before moving the data to your performance warehouse in Azure. The AgentCollectorService, which is a centralized Windows Server for initial data and transmission, requires about 100MB of memory per monitored instance and uses less than 20% CPU. There is minimal resource consumption (CPU, Memory, Storage, etc.) on the monitored SQL Server instances.
Let’s dive in and learn about SQLGrease:
- Enterprise Dashboard
- History View
- Troubleshooting SQL Server Wait Stats
- Capturing Anomalies
- Events and Event Notifications
SQLGrease Enterprise Dashboard
The SQLGrease Enterprise Dashboard focuses on the health of your environment using real time data and slices from the last day, week, month and year for Active Event Notifications, CPU, Waits, Events, Deviation from Baseline and Warehouse Status. On a single pane of glass, you can easily understand the health of your SQL Server database system and from the summarized data, can focus on active or historical issues to begin solving SQL Server performance issues from the eyes of the query optimizer. Much of this performance analysis is performed with machine learning to truly understand if there is an issue, an anomaly or a typical query execution within the SQL database.

SQLGrease History View
Don’t let the SQLGrease History View name mislead you; the historical data is only about 3 minutes behind real time activity in your SQL Server databases. This is one of the main interfaces to troubleshoot performance with a large amount of data and functionality, including:
- Drill into a specific time period data set, database and performance statistic such as Query Elapsed Time, Runtime, Response Time, Waits, Stored Procedure Lapsed Time, etc. for complex queries and SQL statements such as a SELECT statement, SELECT DISTINCT, INSERT INTO, UPDATE or DELETE
- Leverage the interactive interface with the ability to add and remove multiple charts, hover over the charts to see the corresponding code, sort performance data (Total Elapsed Time, CPU Time, Execution Counts, Missing Indexes, etc.), understand data retrieval patterns and more
- Move from macro view to focus on specific aspects of database queries – query plans, execution time for a subquery, large datasets, INNER JOIN, LEFT JOIN, temporary table access, index scan, ORDER BY, GROUP BY or predicates in a WHERE clause to begin rewriting SQL code for improved response time
Let’s checkout a video to see this in action.
Troubleshooting SQL Server Wait Stats
Wait Stats are an important component for SQLGrease which are included in the History, Query Detail and Session Snapshot interfaces. These performance metrics provide insight into what a query is impacted by as it runs and in SQLGrease the wait stats are color coded and summarized to help direct your SQL query optimization. In the video below, see a scenario where SQLGrease aggregates Wait Stats and walk through the process of determining the root cause of the performance issue, which happens to be blocking in this scenario.
Capturing SQL Server Anomalies with SQLGrease
SQLGrease brings machine learning algorithms to the SQL Server platform to determine workload patterns, usage and anomalies as users are querying your Microsoft SQL Server database. This enables SQL Server DBAs and Developers to determine what is considered normal and what is not within a time period, which could be outliers with long executions, excessive lock waits, plan changes and more. Check out the video below to see how quickly SQLGrease can identify these SQL query performance issues.
SQLGrease Events and Event Notifications
SQLGrease ships with intelligent notifications for SQL Server performance related conditions such as time outs, long executions, lock waits, high CPU, etc. The intelligence is focused on alerting based on real issues to minimize false positives and prevent fatigue alert.
The notifications are setup “out of the box”, but can also be customized as needed based on your application workload. The SQLGrease Events and Event Notifications enables you to configure the severity of the message, acknowledge conditions and the number of messages sent in order to ensure the messages are meaningful and not ignored as spam. Let’s check out how this works.
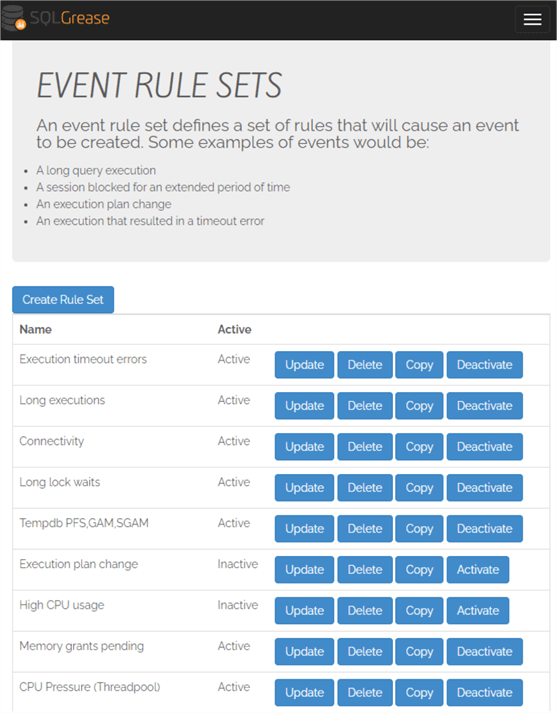
First are the Event Rule Sets, which are enabled out of the box for SQL tuning related performance conditions for items such as Execution Timeout Errors, Long Executions, High CPU, etc.
Next comes Event Rules which help fine tune the Event to either include specification applications, exclude specific times of the day\week when maintenance is occurring, if a query exceeds a certain threshold, etc. Configurable parameters include:
- Field: Command, Database Name, Date of Week, Execution Timeout, Host Name, Login Name, Program Name, Query Hash, Wait Type, etc.
- Relation: Contains, Not In, Starts With, Ends With, <, >, = and other wildcards
- Value(s): SELECT, INSERT, UPDATE, DELETE, DBCC, ALTER, CREATE, DROP, etc. syntax

Event Notification is where everything is tied together – the Event Name, Severity, Notification Frequency, Who is Notified, etc.

This paradigm provides significant granularity over the events, notifications, rules for notifications and who is notified, which enables your team to block out the noise to focus on addressing real issues.
Summary
SQLGrease is focused on SQL query optimization to help SQL Server DBAs and Developers address performance issues on-premises and in the cloud. This tool is built from the ground-up specifically for SQL Server with a simple installation requiring no additional software licensing or hardware to quickly begin troubleshooting performance issues impacting the organization. The licensing is simple, affordable and will easily become the tool of choice for advanced query tuning.
Why choose SQLGrease for SQL Server performance tuning?
- Pinpoint problematic queries
- Anomaly detection
- Prioritize performance issues
- Visibility across SQL Server instance on-premises and in the cloud
- Intuitive interface for SQL Server professionals
- Significant time savings to correct performance problems
- Cost effective across entire SQL Server environment
How can I get started with SQLGrease?
To get started with your free version of SQLGrease simply complete this form and you will be contacted to get started.
Next Steps
- Get Started with SQLGrease – Download Now
- Learn more about SQLGrease
- Review the Installation Guide Video
- SQLGrease Pricing Options
MSSQLTips.com Product Spotlight sponsored by SQLGrease.

Jeremy Kadlec is a Founder, Editor and Author at MSSQLTips.com with more than 300 contributions and 25+ years of SQL Server experience. Jeremy leads a team of more than 300 authors helping millions of SQL Server professionals around the globe every second of the day for the last 20 years. He is also the CTO @ Edgewood Solutions and a six-time SQL Server MVP based on his community contributions. Jeremy brings 25+ years of SQL Server DBA and Developer knowledge to the community and holds a bachelor’s degree from SSU and master’s degree from UMBC.
Brilliant!!!!