Problem
In the first part of this series, we looked at the various functions undertaken by PostgreSQL VACUUM, the features and options for running it manually and the theory behind it, and the way PostgreSQL manages concurrency. Part II is a more practical tip focusing on a more detailed account of what it is and how to tune it versus Part I, which was more about the theory behind how VACUUM works and MVCC is implemented in PostgreSQL.
Solution
This tip will thoroughly discuss AUTOVACUUM and ANALYZE and how to tune them. It will also share how to use scripts to monitor our database for table and index bloating, wraparound problems, and other VACUUM-related topics.
PostgreSQL AUTOVACUUM
We concluded Part I by introducing AUTOVACUUM, a process that automatically checks for tables that need to be vacuumed or analyzed and prevents txid wraparound. This process is enabled by default on all tables and indexes of all the databases in a PostgreSQL cluster, thus on all relations. We can selectively disable AUTOVACUUM on tables and control with various parameters the behavior of the process for a single table or the whole cluster.
Specifically, we have several parameters that tell AUTOVACUUM when to VACUUM a table and others that control how fast and how many resources it can use. Let’s take a look at some of them.
AUTOVACUUM consists of a launcher and many worker processes. A maximum of autovacuum_max_workers worker processes are allowed. This parameter controls the number of workers (threads) that can do the AUTOVACUUM job contemporarily.
The Launcher will start one worker every autovacuum_naptime seconds, workers then check for inserts, updates, and deletes in each table and execute VACUUM and/or ANALYZE as needed depending on the thresholds inserted with the corresponding parameters.
The following thresholds can be modified on a table basis or globally:
autovacuum_vacuum_threshold: This has a default value of 50.autovacuum_vacuum_scale_factor: This has a default value of 0.2.
The formula that controls if a table should be vacuumed or not by AUTOVACUUM is: pg_stat_user_tables.n_dead_tup > (pg_class.reltuples x autovacuum_vacuum_scale_factor) + autovacuum_vacuum_threshold
For example, in a table with 10,000 rows, the number of dead rows has to be over 2,050 ((10,000 x 0.2) + 50) before an AUTOVACUUM kicks off.
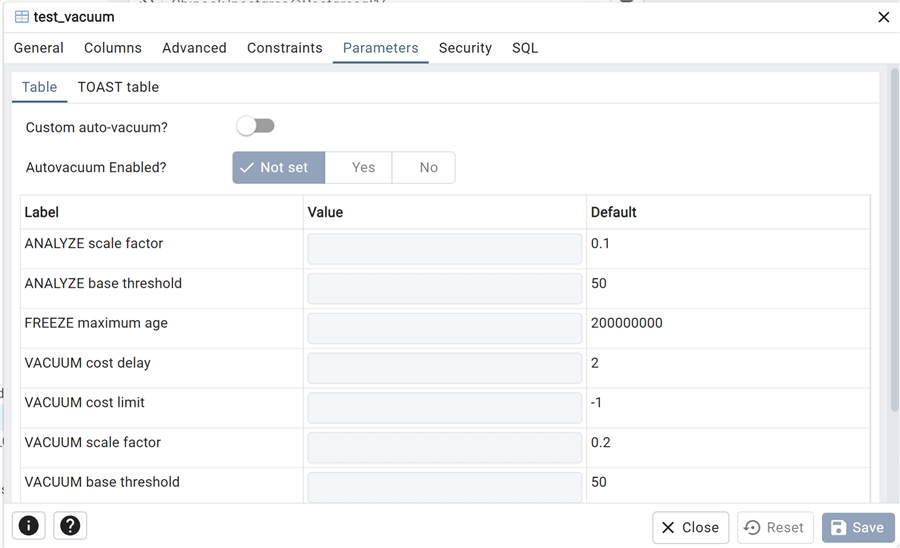
Let’s see it in action. Using the table used in Part I, test_vacuum, we first simulate a large number of updates, keeping the standard parameters. We can easily see all of the table’s parameters from the pgAdmin GUI, clicking on Table Properties, and viewing the Parameters tab:
With a query on catalog view pg_stat_all_tables, we can check when this table was last vacuumed or autovacuumed (as well as analyzed):
--MSSQLTips.com

select schemaname, relname,last_vacuum,last_autovacuum, last_analyze,last_autoanalyze
from pg_stat_all_tables
where relname='test_vacuum';
We also need to check the parameter autovacuum_naptime to see how often AUTOVACUUM process is started:
--MSSQLTips.com

show autovacuum_naptime;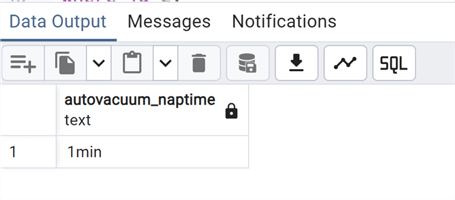
As expected, we have the default: 1 minute.
Now that we have checked that we have a clean situation, let’s do a few table updates to have a number of dead tuples:
--MSSQLTips.com

update test_vacuum
set descrizione='test_vacuum 25'
where (id % 10) = 0;
We wait for 1 minute and issue the query on pg_stat_all_tables again:
As expected, we do not see any changes:

In fact, we have only 10,000 dead tuples that we can see adding a column to the previous query:
--MSSQLTips.com

select schemaname, relname,last_vacuum,last_autovacuum, last_analyze,last_autoanalyze, n_dead_tup
from pg_stat_all_tables
where relname='test_vacuum';
In order to kick off an AUTOVACUUM as per the formula above, we need at least ((100,000 x 0.2) + 50) = 20,050 rows. So, we need to add some more dead tuples to see what happens:
--MSSQLTips.com

update test_vacuum
set descrizione='test_vacuum 27'
where (id % 3) = 0;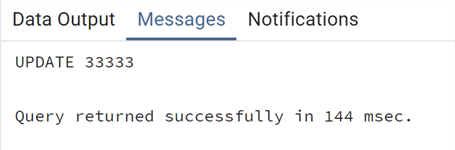
Let’s issue the previous query again after 1 minute:
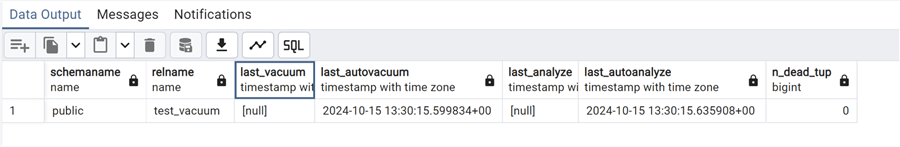
We finally see that AUTOVACUUM was kicked off and has cleaned up all dead tuples, plus has also analyzed the table with AUTOANALYZE, ultimately updating the statistics of the table (more on ANALYZE later).
Now we want to tune it so it performs more often on this particular table. To do that, we modify the parameters of this table by issuing an ALTER TABLE:
--MSSQLTips.com

ALTER TABLE public.test_vacuum SET (
    autovacuum_vacuum_scale_factor = 0.1,
   autovacuum_vacuum_threshold=0);
Try again to update more of the 10,000 rows to get more than 10,000 dead tuples (the new threshold):
--MSSQLTips.com

update test_vacuum
set descrizione='test_vacuum test'
where (id % 9) = 0;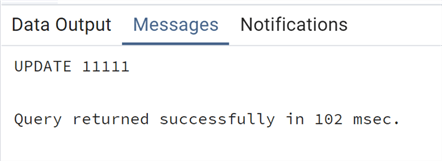
The image below shows that after 1 minute, an AUTOVACUUM is performed on this table and all dead tuples are deleted:

Tuning AUTOVACUUM in PostgreSQL
So far, we have looked at how to tune AUTOVACUUM for a single table, making it run more often than with default settings. One important point about AUTOVACUUM is that even if it only does a VACUUM of the tables and not a FULL/FREEZE (depends on if the threshold for a FREEZE is reached), it is still a resource-intensive process. So, on big databases with many big tables and intense usage, it can take some time and resources to finish.
This is done on purpose – not to use too many I/O resources. In such OLTP databases (with high numbers of UPDATE and DELETE processes), we may need to tune the process to run faster and avoid too much bloating in the tables.
We have a few parameters that can be leveraged:
autovacuum_max_workers: As mentioned above, there is a parameterautovacuum_max_workerswith a default value of 3 that controls the total number of workers used by AUTOVACUUM. For example, we can increase this number to have more parallel workers in action. This action is efficient when dealing with big partitioned tables as the work can be parallelized better on more than one partition. This is the only reason to increase the number of autovacuum workers, as we’ll see in a moment.autovacuum_vacuum_cost_limit: Has a default value of 200 and is the total cost limit AUTOVACUUM could reach. This limit can be increased.- autovacuum_vacuum_cost_delay: Has a default value of 2 milliseconds. This can be reduced or even set to 0. In this case, it will make AUTOVACUUM as fast as a manual VACUUM, that’s to say as fast as possible.
- vacuum_cost_page_hit: This has a default value of 1.
- vacuum_cost_page_miss: This has a default value of 10.
- vacuum_cost_page_dirty: This has a default value of 20.
The autovacuum_vacuum_cost_limit parameter is based on the combination of the last three costs. Pay attention that this is equally divided among all the autovacuum_max_workers running:
individual thread's cost_limit = autovacuum_vacuum_cost_limit / autovacuum_max_workersSo, increasing the autovacuum_max_workers may counterintuitively delay the AUTOVACUUM execution for the currently running AUTOVACUUM workers, as an increased number of worker threads will lower the cost limit for each thread. Each thread is then assigned a lower cost limit, thus it will go to sleep more often as the cost threshold is easily reached, causing the whole AUTOVACUUM process to run slowly.
Instead increasing the autovacuum_vacuum_cost_limit parameter may cause IO bottlenecks as all VACUUM processes are I/O intensive. It is always better to fine tune these parameters for specific big tables with large numbers of DML operations that need a more intense VACUUM, instead of changing these parameters globally in the postgresql.conf file.
Let’s try an example and tune our table for running AUTOVACUUM – not only more often, but faster!
To monitor the time duration of an AUTOVACUUM, we need to modify the log parameter log_autovacuum_min_duration. This way we will log any AUTOVACUUM that will last more than the parameter value, in milliseconds. This parameter can be modified on the postgresql.conf for all the PostgreSQL cluster or only for a table issuing an ALTER TABLE:
--MSSQLTips.com

alter table public.test_vacuum set (log_autovacuum_min_duration=1);
This way, all AUTOVACUUM operations lasting more than 1 milliseconds on this table will be logged. Now we can add more rows to the table to have a more significant and larger dataset where we will actually see a difference in the speed of AUTOVACUUM. Bear in mind that this INSERT itself will prompt AUTOVACUUM to start on this table:
--MSSQLTips.com

insert into test_vacuum values (generate_series(1000000,11000000), 'Test vacuum new');
Check the log:
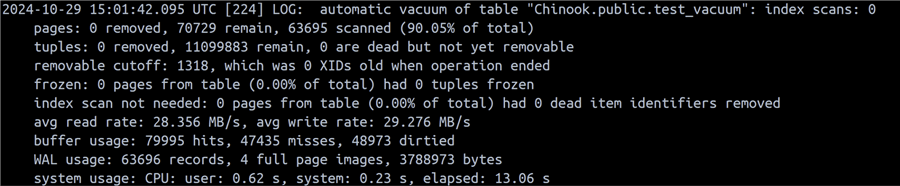
We have a load of information here. The one that interests us now is the elapsed time of 13.06 seconds. Let’s issue an UPDATE to generate some dead tuples and trigger another AUTOVACUUM:
--MSSQLTips.com

update test_vacuum
set descrizione='test_vacuum test'
where (id % 9) = 0;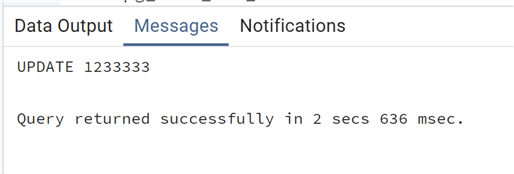
Check the log again:

We can see that the AUTOVACUUM lasted 21.94 seconds to clean all the dead tuples. Let’s modify the parameters to give more resources to the AUTOVACUUM of the test_vacuum table – raising the cost limit and pushing down the delay:
--MSSQLTips.com

ALTER TABLE public.test_vacuum SET (autovacuum_vacuum_cost_limit = 500, autovacuum_vacuum_cost_delay = 1);
Time to issue the UPDATE again to see a new AUTOVACUUM in action:
--MSSQLTips.com

update test_vacuum
set descrizione='test_vacuum test 2'
where (id % 9) = 0;

As we can see, with the same number of dead tuples, the elapsed time dropped to 4.17 seconds, a huge improvement. Even if the number of frozen tuples is lower, this AUTOVACUUM would have been faster anyway. In fact, the average read and write rates are respectively 121.771 MB/s and 123.940 MB/s from the previous rates of 22.598 MB/s and 27.872 MB/s!
Monitoring PostgreSQL AUTOVACUUM Process, Table Bloating and Wraparound
There are some useful queries that can be used to monitor both the execution of AUTOVACUUM and the need for one (or for a VACUUM). Some have already been introduced. Another very important one that can be used specifically when AUTOVACUUM is running is pg_stat_progress_vacuum, using the view.
Let’s trigger another AUTOVACUUM with an UPDATE on our test table to see it in action:
--MSSQLTips.com

select pid,
  now() - xact_start AS duration,
  vacprog.datname AS database,
  relid::regclass AS table,
  phase, index_vacuum_count,
  num_dead_tuples, max_dead_tuples
from pg_stat_progress_vacuum as vacprog
JOIN pg_stat_activity as active using (pid);
We can see that we caught the very beginning of the process: still in the scanning phase, counting dead tuples, with a duration still under a second. This is a nice way to see the progress of the AUTOVACUUM on large databases/tables while it is running. Please note that it also indicates if it performs the process on an index, as they are treated the same as tables.
Another useful query that is used to identify the possibility of a transaction id wraparound, instead of monitoring the number of remaining txid, is:
--MSSQLTips.com

select datname, age(datfrozenxid) as frozen_xid_age,
round(100*(age(datfrozenxid)/2146483647.0::float)) as consumed_txid_pct,
current_setting('autovacuum_freeze_max_age')::int - age(datfrozenxid) as remaining_aggressive_vacuum
from pg_database;
This query gives an immediate idea of the situation on our PostgreSQL cluster in our test database. We have plenty of txid and we are not near any wraparound condition.
I already introduced above a query used instead for monitoring dead tuples, as well as last occurrences of AUTOVACUUM/VACUUM and AUTOANALYZE/ANALYZE. But in order to have a better picture of table bloating, there is a specific extension to be installed, pgstattuple:
--MSSQLTips.com

CREATE EXTENSION pgstattuple;
At this point, we can use the extension to check our test table:
--MSSQLTips.com

select pg_size_pretty(table_len) as table_size, tuple_count, pg_size_pretty(tuple_len) as live_tuple_size,
tuple_percent as pct_live_tuples,dead_tuple_count, pg_size_pretty(dead_tuple_len) as dead_tuple_size,
dead_tuple_percent, pg_size_pretty(free_space) as free_space_size, free_percent
from pgstattuple('test_vacuum');
As you can see, we have information about the size of the table, the number of dead tuples and live ones, and percentage. The most important data are the dead tuple percentage and size as well as the free size of the table. These data give us an idea of the level of bloating of the table, i.e., the need for a VACUUM or a VACUUM FULL. For example, we can run a simple query to get the list of the most bloated tables in the database and then analyze them deeper with the below query:
--MSSQLTips.com

select relname,(pgstattuple(oid)).dead_tuple_percent
from pg_class
where relkind = 'r'
order by dead_tuple_percent desc;
This result set gives us an idea of the tables that need further investigation, and maybe a fine tune with the AUTOVACUUM parameters.
PostgreSQL ANALYZE and AUTOANALYZE Processes
The same considerations and tips that we have just made for AUTOVACUUM also apply to the AUTOANALYZE process. But first, we need to explain in more detail what ANALYZE and AUTOANALYZE do!
As mentioned previously, an ANALYZE operation investigates the contents of all the tables and collects statistics about the distribution of values in each column of every table. PostgreSQL query engine uses these statistics to find the best query plan. As rows are inserted, deleted, and updated in a database, the column statistics also change. ANALYZE, which is run automatically after an AUTOVACUUM, ensures the statistics are updated. Note: If we run a manual ANALYZE instead, we rebuild the statistics, causing more pressure on the I/O resources of our PostgreSQL cluster. This is one reason not to run a manual VACUUM ANALYZE.
The parameters that control AUTOANALYZE mirror those of AUTOVACUUM seen above:
- autovacuum_analyze_threshold
- autovacuum_analyze_scale_factor
With the same meaning as the autovacuum_vacuum parameters, we can change them on our test table. Bear in mind that an AUTOVACUUM is always followed by an AUTOANALYZE in order to keep the statistics up-to-date.
--MSSQLTips.com

ALTER TABLE public.test_vacuum SET (
    autovacuum_analyze_scale_factor = 0.1,
    autovacuum_analyze_threshold=1);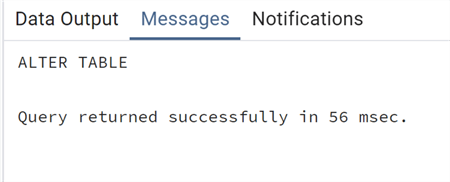
As you can see with this simple query below, we have also modified the parameters for AUTOANALYZE, even if it is triggered automatically after an AUTOVACUUM:
--MSSQLTips.com

select schemaname, relname,last_vacuum,
last_autovacuum, last_analyze,last_autoanalyze,
n_dead_tup
from pg_stat_all_tables
where relname='test_vacuum';
The last_autoanalyze was performed right after the last_autovacuum finished.
Things to Keep in Mind with AUTOVACUUM/VACUUM and AUTOANALYZE/ANALYZE Processes
There are some important points to remember with VACUUM and ANALYZE processes. As we pointed out, these are I/O resources intensive. So, unless we are in a specific scenario, it is always better to not do a manual VACUUM but to leave it to the AUTOVACUUM process. As we have seen, if there are specific needs on some tables, the suggestion is to fine-tune the AUTOVACUUM process of these tables.
One specific case, when it makes sense to run a VACUUM ANALYZE on a table, is after a bulk INSERT or DELETE that significantly changes the size of the table and its indexes. Since this is a single operation and we do not want to change the AUTOVACUUM parameters for that specific table or wait until it starts, it makes sense to run it manually. Always remember that it will put some pressure on the resources on big tables!
Another important point is that temporary tables cannot be accessed by AUTOVACUUM. In this case, particularly if the temp table has many DMLs, we need to perform a manual VACUUM ANALYZE to keep the number of dead tuples low and maintain good performance by having up-to-date statistics used by the optimizer.
Next Steps
In this tip, we have reviewed one of the most important processes of PostgreSQL VACUUM, sharing suggestions on how to optimize the automatic AUTOVACUUM and AUTOANALYZE as well as many scripts to monitor the processes and the tables/indexes bloating.
As always, below are links to the official documentation:
