Problem
How do we monitor for query performance inside PostgreSQL and find problematic queries? How do we check table statistics? Let’s look at how to use pg_stat_statements and pgAdmin to monitor PostgreSQL.
Solution
In this article, we review some of the most important queries and open-source extensions available to monitor PostgreSQL query performance. In particular the extension pg_stat_statements, but also other statistic collection views. Moreover, we will also check other ways to monitor our PostgreSQL cluster using pgAdmin.
Monitoring Queries with pg_stat_statements
The extension pg_stat_statements is used to monitor for slow-running or problematic queries. It creates two new system views, pg_stat_statements and pg_stat_statements_info, plus the functions pg_stat_statements_reset and pg_stat_statements. Please note that, in this way, we monitor for something that has already happened, i.e., monitoring statements after they are executed, not during executions, as was the case with pg_stat_activity , which was covered in the previous tip: PostgreSQL monitoring with pg_stat_activity and pg_locks.
Enable pg_stat_statements
The extension should be enabled in each single database where we want to use it, using the following command:
--MSSQLTips.com

CREATE EXTENSION pg_stat_statements;
Importantly, since this extension makes use of additional shared memory, we need to add a line to the configuration file postgresql.conf for the pg_stat_statements module to be loaded in the shared preloaded libraries:
--MSSQLTips.com

shared_preload_libraries: pg_stat_statements
Note: Adding this parameter requires the restart of the PostgreSQL cluster to be applied. For more on configuration files of PostgreSQL, see this tip: PostgreSQL Download and Install on Ubuntu, RedHat and Docker.
At this point, we can issue the CREATE EXTENSION command in the database that we want to monitor, and we’re good to go. Statistics about query executions will be collected, and we will see them querying the pg_stat_statements view.
Using pgbench to simulate Database Traffic
Clearly, we need to simulate some traffic in our test database to have some meaningful data. We can use pgbench. All PostgreSQL clusters come with pgbench, a simple program for running benchmark tests on PostgreSQL. It simulates a transactional load with INSERTS, UPDATES, and SELECTS on four tables, automatically created, and in multiple concurrent sessions. It can be customized for a specific load with different queries from the default options. All the information can be found in the official documentation: pgbench.
For our scope, we will use the standard load along with some parameters to enhance the simulated traffic. First, we initialize pgbench, creating the appropriate standard tables with data inside. The number of rows can be controlled by specifying the parameter -s, which gives the scale. For this purpose, we will use scale 100. From a Linux shell, issue the following command:
--MSSQLTips.com

pgbench -U postgres -i -s 100 chinook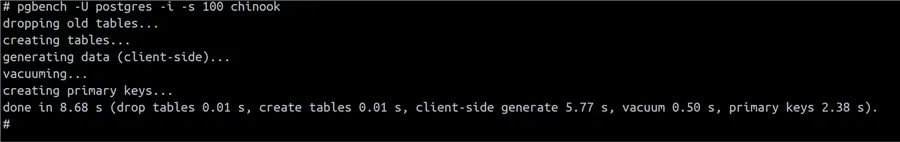
We can now check the tables in our chinook database:

There are 4 new tables added with the prefix pgbench. Let’s look to see how much data are inside:
--MSSQLTips.com

SELECT aid, bid, abalance, filler
FROM public.pgbench_accounts;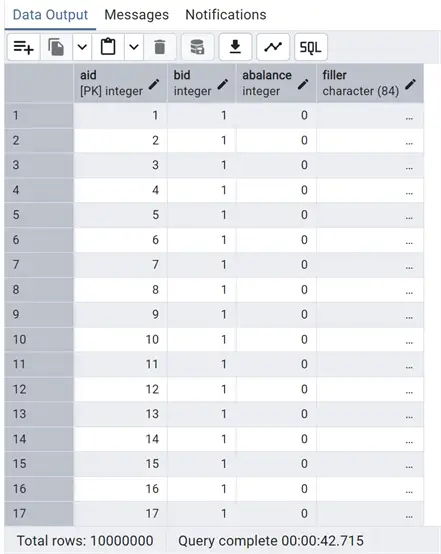
Now having quite a bit of data in the tables and finished with the initialization of pgbench, we can run it to generate traffic:
--MSSQLTips.com

pgbench -U postgres -c 50 -j 3 -T 120 chinook
The following are the meanings of the parameters:
- -U = the role that runs all the queries.
- -c = the number of sessions.
- -j = the number of threads.
- -T = the time in seconds of the test duration.
After two minutes, we can view the results:
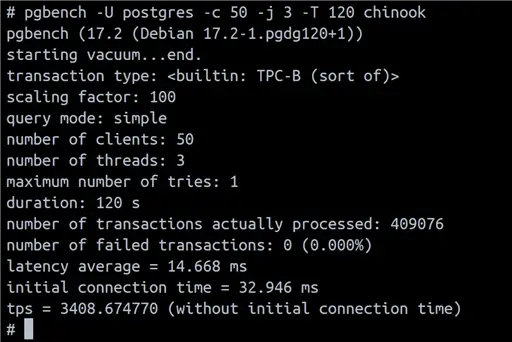
Since it is a benchmark program, pgbench provides a baseline of how well our PostgreSQL Cluster works. In doing so, it has processed a large number of queries that we can now check using pg_stat_statements.
Review Collected Data
Let’s look at the info about statistics collected by pg_stat_statements using the info view pg_stat_statements_info:
--MSSQLTips.com

select *
from pg_stat_statements_info;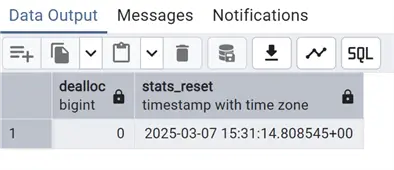
The result is always one row showing the last time the statistics were reset, or the time since we are collecting new statistics. On the dealloc column, the number of entries about the least-executed statements that have been deallocated if we are over the pg_stat_statements.max parameter.
Query Performance Slowest Queries
Finally, let’s see some performance query. First, we can see the top 20 slowest queries:
--MSSQLTips.com

--Top 20 slowest queries
SELECT userid::regrole,datname as dbname,  substring(query, 1, 100) AS short_query,
round(total_exec_time::numeric, 2) AS total_exec_time,calls,round(mean_exec_time::numeric, 2) AS mean,
round((100 * total_exec_time /sum(total_exec_time::numeric) OVER ())::numeric, 2) AS percentage
FROM    pg_stat_statements
inner join pg_database
on dbid=oid
ORDER BY total_exec_time DESC
limit 20;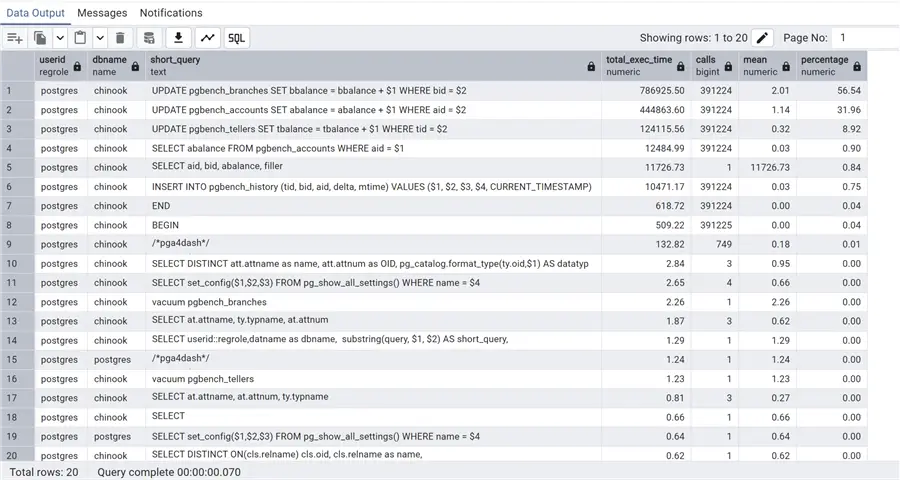
Here, we have extracted the top 20 queries by total execution time, so not considering the single execution time but the total for all the calls to the same query. Obviously, we see at the top all the queries with a large number of calls. As expected, these are the queries called by pgbench.
All the times are in milliseconds (ms). Even if for the first rows we see a high total_exec_time, we still have a mean time of 2 ms. Instead, on row 5, we have just one execution with a mean time of 11726 ms, or 11 seconds – this is something that should be investigated. In fact, this is the select query that we did on the pgbench_accounts table without any filter to show the total rows. In the last column, we calculate the percentage of this query time on the total time used by all queries. This will help to recognize the heaviest query in our PostgreSQL cluster immediately.
Most Time Consuming Queries
Another typical performance inquiry is to get the most time-consuming queries in our cluster:
--MSSQLTips.com

--top time consuming
select userid::regrole, datname as dbname, substring(query, 1, 100) AS short_query,
calls, total_exec_time/1000 as total_time_seconds ,min_exec_time/1000 as min_time_seconds,
max_exec_time/1000 as max_time_seconds,mean_exec_time/1000 as mean_time_seconds
from pg_stat_statements
inner join pg_database
on dbid=oid
order by mean_exec_time desc
limit 20;
With this, we can see the top 20 queries with the highest mean execution time in seconds, also including the min and max execution times, as well as total calls and time spent. Another powerful way to analyze potential problems in performances!
Queries by Execution Time
Another way to catch problematic queries is to check all execution times over a certain threshold. For the following example, the threshold is over 1 ms:
--MSSQLTips.com

--Queries over threshold
select rolname, datname as dbname,substring(query, 1, 100) AS short_query, total_exec_time/calls as avgtime_milliseconds, calls,
100.0 * shared_blks_hit /
               nullif(shared_blks_hit + shared_blks_read, 0) AS hit_percent
from pg_stat_statements
inner join pg_authid aut
on userid=aut.oid
inner join pg_database datab
on dbid=datab.oid
where total_exec_time/calls>1
order by avgtime_milliseconds desc;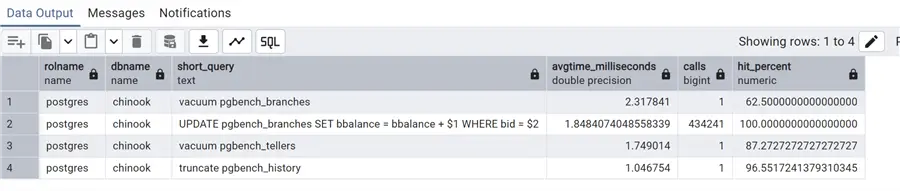
In this case, we have added also a hit percent column using the shared_blks_hit and shared_blks_read columns of pg_stat_statements. This represents the number of shared block cache hits vs. the shared block reads by the statement, giving us an idea of the cache hits. Additionally, all these queries can be further refined by adding filters for database name or username (rolname).
High I/O Queries
We can now check for high I/O in the statements. Pay attention that the I/O timings are collected only if parameter track_io_timing is set to on; otherwise, we will always have 0. Also, beware of the possible overhead:
--MSSQLTips.com

--High I/O activity
select userid::regrole, datname as dbname, substring(query, 1, 100) AS short_query,
calls,round(mean_exec_time::numeric/1000,4) as mean_time_seconds,
(shared_blk_read_time+shared_blk_write_time+local_blk_read_time+local_blk_write_time+temp_blk_read_time+temp_blk_write_time) as io_time
from pg_stat_statements
inner join pg_database
on dbid=oid
order by io_time desc
limit 20;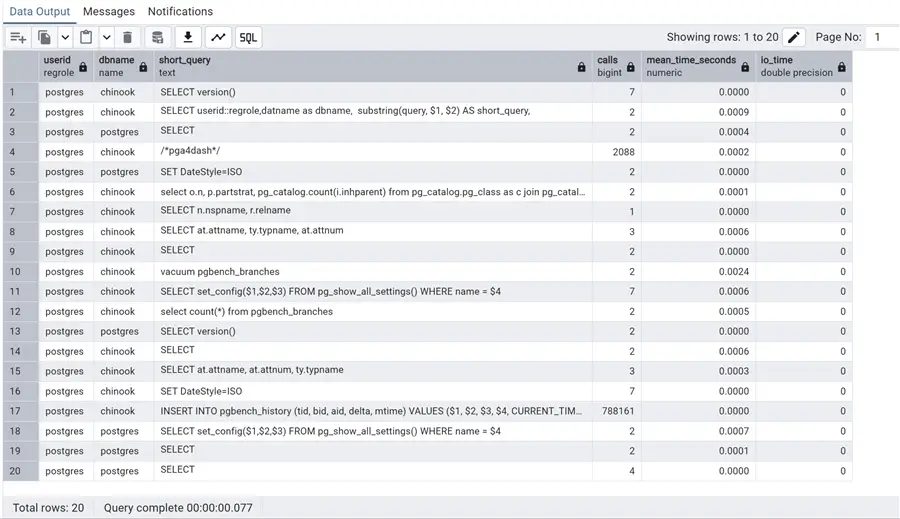
Now, we can rate all the executed queries in our environment by the total amount of I/O done, both write and read. In this last one, all times are in seconds instead of milliseconds (and we do not have a lot of I/O going on, as you can see!).
Reset Statistics
Another important feature of pg_stat_statements is the possibility to reset the statistics, even for specific statements, using the function pg_stat_statements_reset(). For example, we can identify the query we want to restart the statistics – the UPDATE that was taking more than 1 ms:
--MSSQLTips.com

select userid, dbid, queryid, substring(query, 1, 100) AS short_query
from pg_stat_statements
where substring(query, 1, 100) like 'UPDATE pgbench_branches%';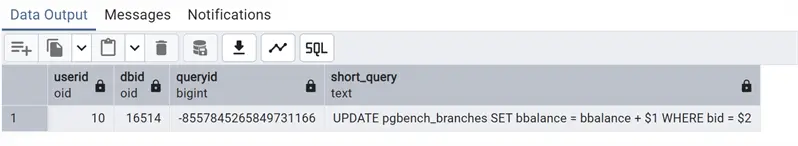
Now, with userid, dbid, and queryid, we can use the reset function:
--MSSQLTips.com

select pg_stat_statements_reset(10,16514,-8557845265849731166) --userid Oid, dbid Oid, queryid bigint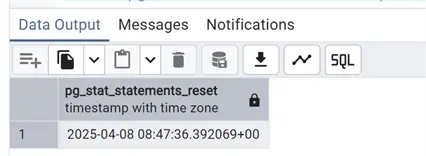
To check that the statistics have been reset only for this statement, we issue again the script for the query over 1 ms:
--MSSQLTips.com

select rolname, datname as dbname,substring(query, 1, 100) AS short_query, total_exec_time/calls as avgtime_milliseconds, calls,
100.0 * shared_blks_hit /
               nullif(shared_blks_hit + shared_blks_read, 0) AS hit_percent
from pg_stat_statements
inner join pg_authid aut
on userid=aut.oid
inner join pg_database datab
on dbid=datab.oid
where total_exec_time/calls>1
order by avgtime_milliseconds desc; 
We see that now the UPDATE query is no longer in the list of the statements over 1 ms.
Monitoring I/O with pg_stat_io
So far, we have seen how to monitor the statements running in our PostgreSQL cluster, specifically, in one of the last scripts, we saw how to monitor for high I/O queries. In order to dig deeper into I/O statistics, starting from PostgreSQL version 16, we can use the view pg_stat_io. As mentioned above, this works with timings only if the parameter track_io_timing is set to ON.
One parameter to watch in terms of I/O for better performance is how much data we get from memory vs. what we actually have to read from disk, considering getting data from disk is generally slower. We would like to know the percentage of hits on the shared_buffer, and if it is not flushed too much, it indicates that we set a shared_buffer parameter in the config parameters too low. See this tip on setting up PostgreSQL for where to change parameters: PostgreSQL Download and Install on Ubuntu, RedHat and Docker.
Using pg_stat_io
The previous queries on pg_stat_statements can give an idea of what we are talking about. However, as I was explaining above, the best way to check for excessive I/O is querying the view pg_stat_io. For example, using the specific query below, we will get info on the hit ratio of what client queries are getting in memory vs. what’s on disk, as well as client backend read and writes. Kudos to How to Get the Most out of Postgres Memory Settings.
--MSSQLTips.com

SELECT (hits / (reads + hits)::float) AS hit_ratio,
       reads, writes
  FROM pg_stat_io
 WHERE backend_type = 'client backend'
   AND context = 'normal'
   AND object = 'relation';
In this case, a hit ratio close to 1 suggests that we may need to increase shared_buffers since the same pages are cycling too much.
Let’s briefly discuss the three columns used in the above query as filters: backend_type, context, and object:
backend_typeis present also in the viewpg_stat_activityand has the exact same meaning, giving us an idea of the type of backend, i.e., client or vacuum.contextis used to identify the context of the operation, i.e., vacuum or normal.objecthas information on the target of the I/O operation. This can be a relation (table) or temp relation (temporary table).
See the official documentation page for a complete list of all columns with their meaning in the pg_stat_io view: 27.2.13. pg_stat_io.
Monitoring using pgAdmin
Last but not least, we can see what’s going on in a PostgreSQL Cluster directly from the pgAdmin GUI. Basically, this information is a graphical representation of pg_stat_activity and pg_locks, plus additional info, on configuration and logs. Let’s take a look.
Immediately when we connect to a PostgreSQL cluster with pgAdmin, selecting it from the left frame and expanding the tree, we have a Dashboard panel that, by default, is set on the activity subpanel:
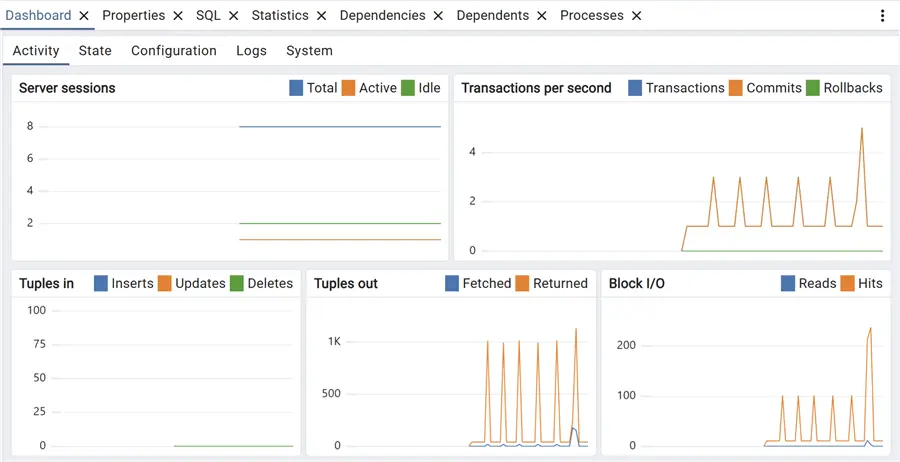
These charts are already giving an idea of what’s going on in our cluster, with info on sessions and transactions, but the interesting part comes out on the State subpanel:
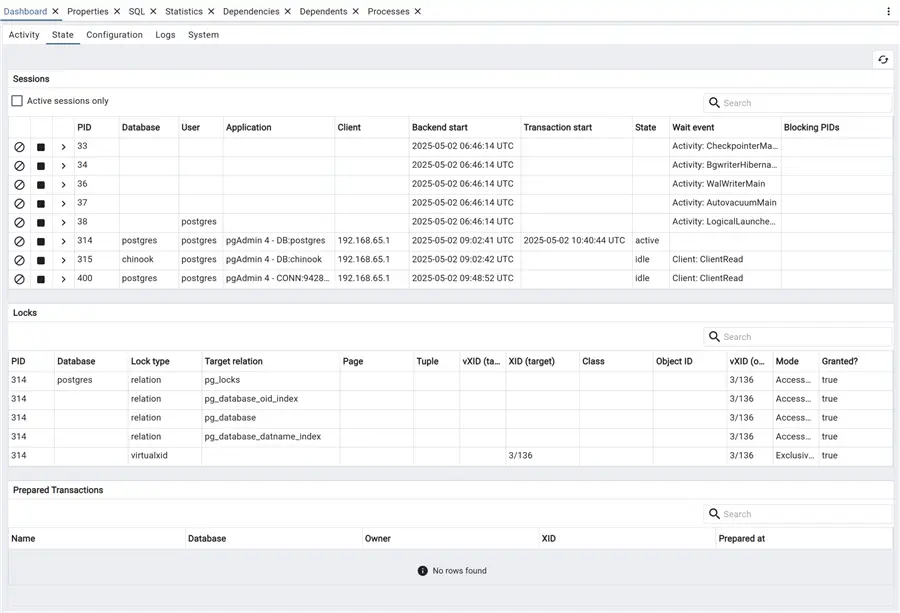
As you can see on this page, most of the information that we can obtain with the two views pg_stat_activity and pg_locks is captured here, including information on prepared transactions. We can also filter for active sessions and search for specific transactions.
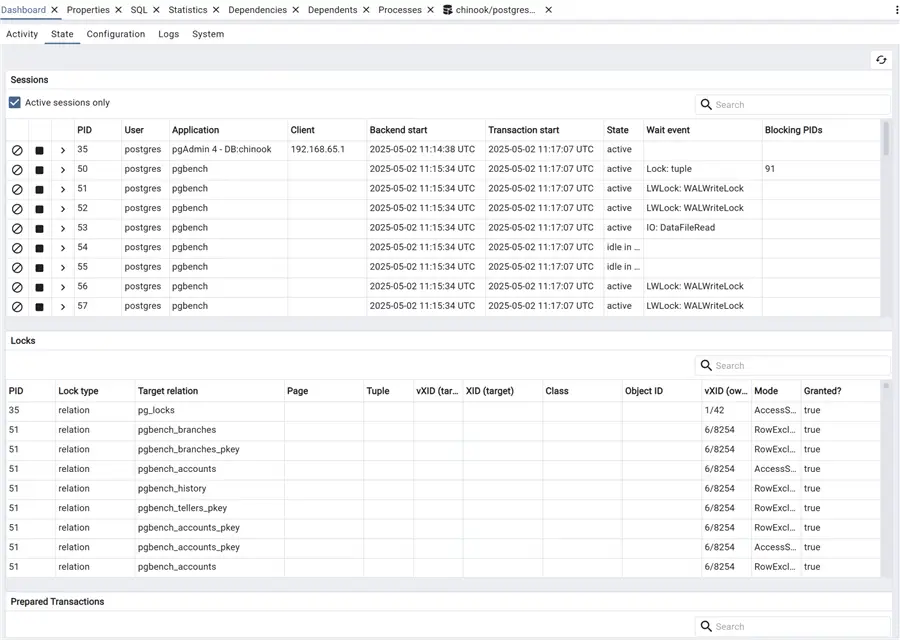
Generate More Traffic
If we call pgbench again to generate some more traffic, we see a different picture:

Now we can take a look at the third tab, Configuration:
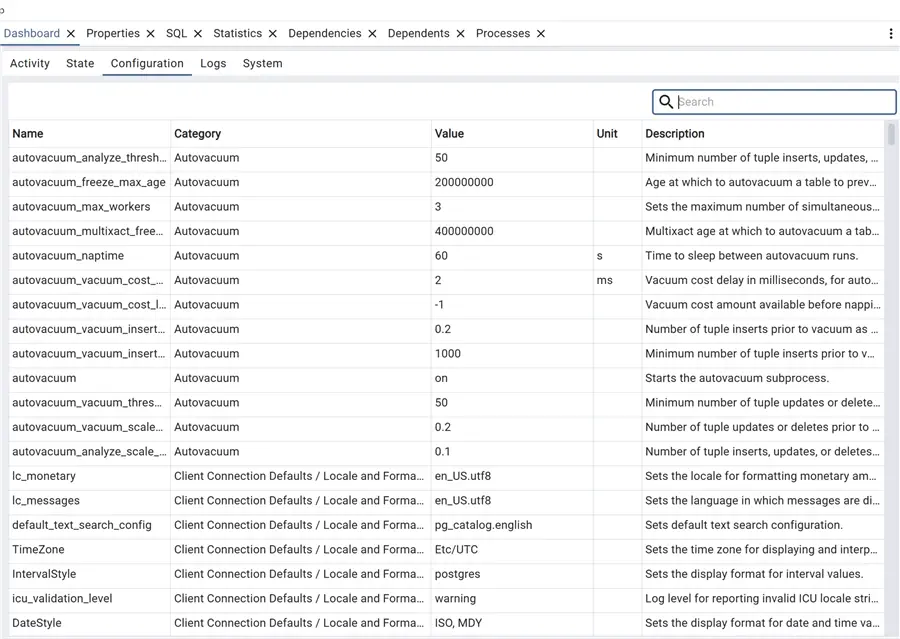
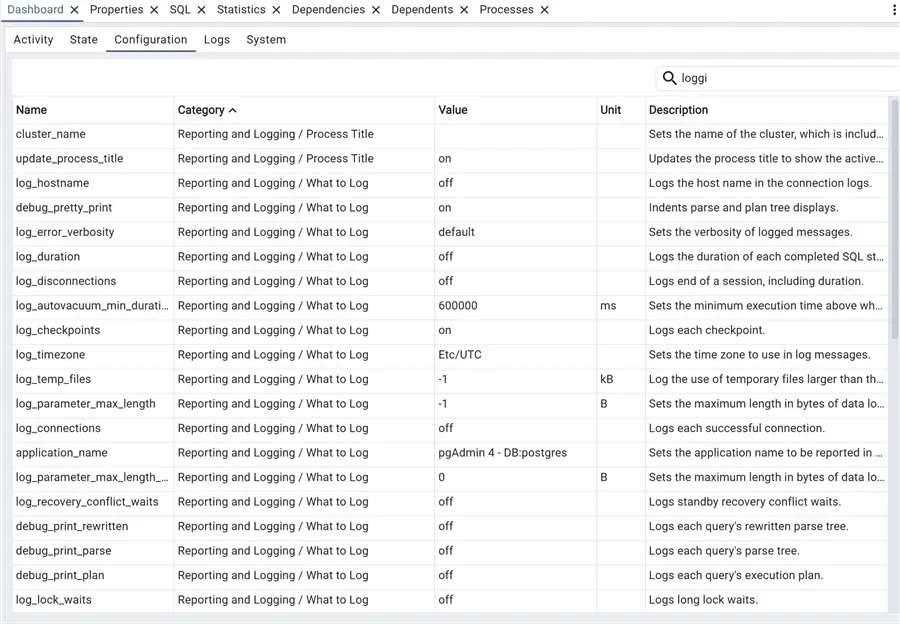
This is handy! We have all the parameters that are in the postgresql.conf file on one page, with the ability to search and order by name or category! This is a very nice feature. For example, we can easily obtain the list of all specific parameters for one specific category, in this case, logging:
Speaking of logging, the next tab has them all, Logs:
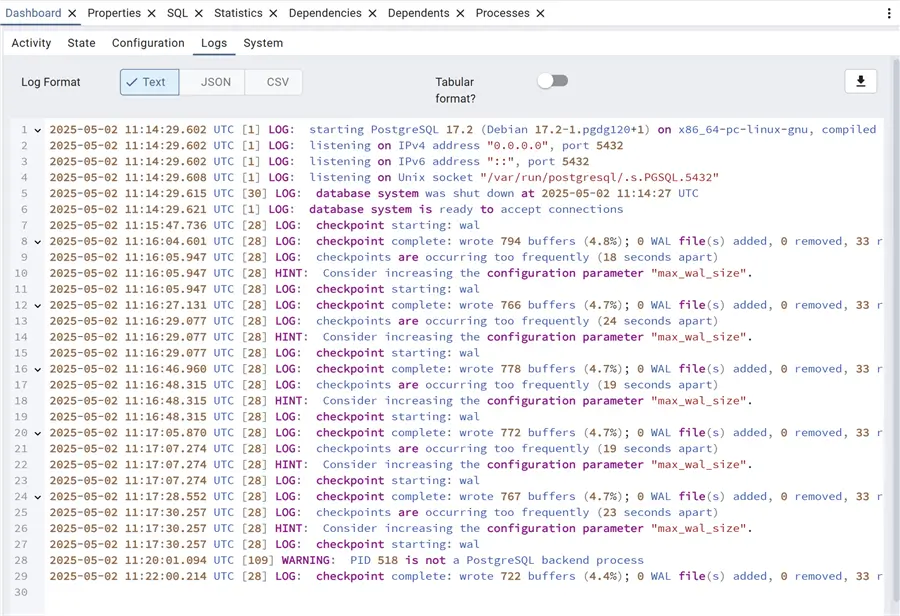
Here, we see immediately the current day PostgreSQL log, which can be downloaded or viewed in different formats. Specifically, we already have a hint proposed in the logs. As a consequence of the pgbench workload, we can see that the checkpoints are occurring too frequently; thus, PostgreSQL itself suggests increasing the max_wal_size parameter to reduce the number of checkpoints. This is valid if we have a high number of DML transactions on the cluster, if this is the case for the pgbench workload that will not be repeatable and it is not necessary to modify the max_wal_size parameter.
Next Steps
In this Part 2 tip on monitoring in PostgreSQL, we have seen some interesting queries based on the pg_stat_statements extension to check the performance of our SQL statements. We have also seen the system view pg_stat_io used to monitor I/O statistics, as well as what information we can easily obtain from the pgAdmin GUI Dashboard. This is by no means a complete list of all that is available for monitoring PostgreSQL; however, these are considered the most important ones.
As always, below are links to the official PostgreSQL documentation:

Andrea Gnemmi is a Database and Data Warehouse professional with almost 20 years of experience, having started his career in Database Administration with SQL Server 2000.
His expertise ranges from SQL Server to Oracle and Postgres for database administration and from SAP BO to SSIS, SSRS and Power BI regarding BI and ETL.
He has worked both in SQL Server and Oracle mostly in multinational environments with very high transaction volumes and large datasets. Performance tuning, indexing techniques and in general Database administration are his hot topics. Ensuring a 24/7 uptime of the various databases in shop is his main responsibility, as well as the best possible performances of all queries run on the databases. He has started working with PostgreSQL two years ago loving many of the features of this RDBMS.
- MSSQLTips Awards: Trendsetter (25+ tips) – 2024 | Rookie of the Year – 2021


Useful