Problem
We all know the importance of monitoring our RDBMS to ensure the performance and availability. Are there any tools that provide functionality to better to monitor PostgreSQL databases? In this article we will explore pg_stat_activity and pg_locks.
Solution
This two-part tip will review some of the most important queries and open-source extensions available for monitoring PostgreSQL and its performance. In particular, this series covers two views, pg_stat_statements and pg_stat_activity, along with other statistic collection views. This first part is dedicated to those views that help to check what’s currently going on in a PostgreSQL cluster: pg_stat_activity and pg_locks system views.
Monitoring PostgreSQL
Like all RDBMSs, there is a set of queries devoted to monitoring and checking what’s going on in PostgreSQL. Add to this the idea that every DBA has developed its specific subset of queries with direct experience of past problems and solutions.
First, let’s review basic concepts about monitoring:
- Database monitoring consists of capturing and recording database events.
- This information helps anyone who monitors databases to detect, identify, and fix potential database performance issues.
- Database monitoring statistics make it easy to monitor the health and performance of PostgreSQL databases.
Statistics and Statistics Collection
Before diving into available monitoring tools and queries, we must discuss briefly the statistics and the statistic collection on which all monitoring is based. Database statistics catalog tables store database activity information. (These are not the table statistics used by the optimizer). The activities stored are:
- Current running sessions
- Running SQL
- Locks
- DML counts
- Row counts
- Index usage
But how are these statistics collected? As per official documentation:
“Cumulative statistics are collected in shared memory. Every PostgreSQL process collects statistics locally, then updates the shared data at appropriate intervals. When a server, including a physical replica, shuts down cleanly, a permanent copy of the statistics data is stored in the pg_stat subdirectory, so that statistics can be retained across server restarts. In contrast, when starting from an unclean shutdown (e.g., after an immediate shutdown, a server crash, starting from a base backup, and point-in-time recovery), all statistics counters are reset.”
All these statistics are then available on multiple views in the pg_catalog schema. For example:
| Table or View | Description |
|---|---|
| pg_class and pg_stats | Catalog tables that stores all statistics (these are the ones used by optimizer, collected by ANALYZE) |
| pg_stat_database | System view that can be used to view stats information about a database and temporary file counts and sizes |
| pg_stat_bgwriter | Shows background writer stats and checkpoint timing information |
| pg_stat_user_tables | Shows information about activities on a table like inserts, updates, deletes, vacuum, autovacuum, etc. |
| pg_stat_user_indexes | Shows information about index usage for all user tables |
| pg_stat_progress_vacuum | Shows one row for each backend, including autovacuum worker processes currently vacuuming |
| pg_stat_progress_create_index | Shows progress of CREATE INDEX and REINDEX operations |
We have already used some of these objects in my previous tip on VACUUM. These objects were explained in the second part related to monitoring tables in need of a VACCUM and to see the progress. Check out this tip – PostgreSQL VACUUM, AUTOVACUUM and ANALYZE Processes.
Now, let’s dive into what is available on PostgreSQL to monitor activities, queries, and tables, starting with how to check the actual cluster activity.
Monitor Current Activity using pg_stat_activity
In order to monitor what is happening in real-time in the database, use the view pg_stat_activity. This view has one row per server process, showing information related to the current activity of that process.
This view is part of the cumulative statistics system that supports the collection and reporting of information about server activity. One part of the system is dynamic statistics views, such as the pg_stat_activity, that tell exactly what’s going on in your system, while another part is collected statistics views that give you an idea of the system usage.
So, let’s take a look at the view and how it can be used. Since it has many columns, we start with a query that I use often for checking long-time running queries. First, we create a query that will run for 6 minutes, using the pg_sleep function:
--MSSQLTips.com
select pg_sleep(360);
We wait for 5 minutes and issue the following query in another session:
--MSSQLTips.com
SELECT pid, user, query_start,
current_timestamp - pg_stat_activity.query_start AS query_time,
state, substring(query, 100) as query_short, wait_event_type, wait_event
FROM pg_stat_activity
WHERE (current_timestamp - pg_stat_activity.query_start) > interval '5 minutes' and state <> 'idle';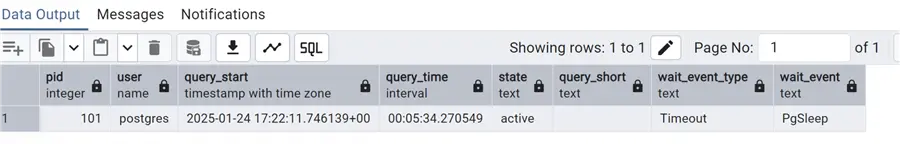
We can see our query with the start date and time of the query, running time (that we calculated), a sample of the query text (not in this case), and the wait event.
Pay particular attention to the wait_event_type and wait_event columns, as they can give clues as to why our query is slow. A wait event means that our query is not running and is waiting for some other external event; in this case, the forced timeout with PgSleep. But in other cases, it could be I/O or a lock event. More on this later.
Other interesting information provided by pg_stat_activity are those related to the application name, IP address, and database name.
Another Example
Let’s do another quick example: extracting the idle sessions older than 30 minutes in the PostgreSQL cluster.
--MSSQLTips.com
SELECT pid,datname,application_name, client_addr, user, query_start,
state
FROM pg_stat_activity
WHERE pid <> pg_backend_pid()
   AND state in ('idle', 'idle in transaction', 'idle in transaction (aborted)', 'disabled')
   AND state_change < current_timestamp - INTERVAL '30' MINUTE;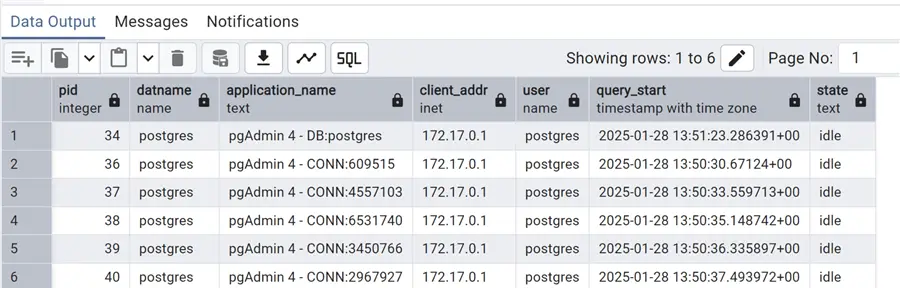
Beforehand, I simulated a few idle sessions from my workstation, opening multiple sessions within pgAdmin. They all appeared with this query. Still, there is more we can do. Let’s kill these idle sessions with a slightly different query, using pg_terminate_backend function:
--MSSQLTips.com
SELECT pg_terminate_backend(pid)
FROM pg_stat_activity
WHERE pid <> pg_backend_pid()
   AND state in ('idle', 'idle in transaction', 'idle in transaction (aborted)', 'disabled')
   AND state_change < current_timestamp - INTERVAL '30' MINUTE;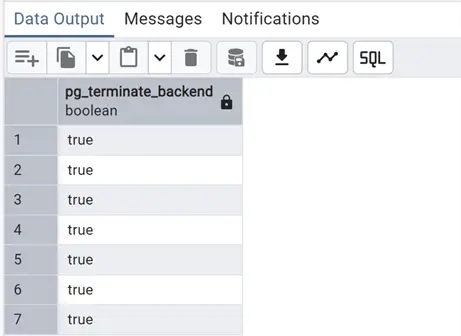
We can also add more filters, such as the database name or the username, to pinpoint the sessions to terminate.
Likewise, we can count the number of total active sessions or the number of total sessions and compare them with the max_connections set in the postgresql.conf settings.
Below will only return the number of active sessions:
--MSSQLTips.com
select count(pid) active_sessions
from pg_stat_activity
where state='active';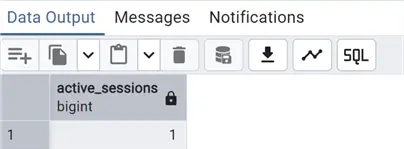
While this one returns the total active vs. max_connections:
--MSSQLTips.com
with total_sessions as
(select count(pid) tot
from pg_stat_activity),
max_conn as
(SELECT
setting::float
FROM pg_settings
WHERE name = 'max_connections')
select tot as total_sessions, setting as max_connections, round(tot/setting::numeric(10,2)*100,2) as perc_max_connections
from total_sessions
cross join max_conn;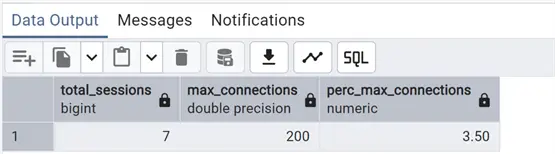
Here we are showing the percentage of used connections compared to the max_connections setting. For more information about this and other parameters, see my article on installing and configuring PostgreSQL: PostgreSQL Download and Install on Ubuntu, RedHat and Docker.
As mentioned above, the wait types of pg_stat_activity are useful to understand what is going on. The official documentation uses a series of tables to describe both wait types and every single wait event: Wait Event Types.
Starting with PostgreSQL version 17, we can even add this description directly in our monitoring query using the pg_wait_events system view. Below is an example of joining this with our previous script for long running queries:
--MSSQLTips.com
SELECT pid, user, query_start,
current_timestamp - active.query_start AS query_time,
state, substring(query, 100) as query_short, wait_event_type, wait_event, wait.description
FROM pg_stat_activity as active
inner JOIN pg_wait_events as wait
ON active.wait_event_type = wait.type AND active.wait_event = wait.name
WHERE (current_timestamp - active.query_start) > interval '5 minutes' and state <> 'idle';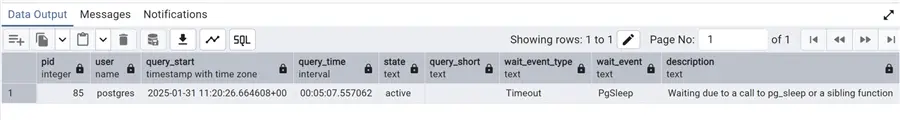
Notably, one of the most important wait types is the lock one. Even if PostgreSQL implements MVCC (see PostgreSQL VACUUM, AUTOVACUUM, and ANALYZE Processes for Deleted Data) and has less locks compared to the default isolation of SQL Server, many cases still exist where an exclusive lock is needed.
To monitor locks, use pg_stat_activity in conjunction with pg_locks.
Monitoring Locks with pg_locks View
First of all, a brief introduction to PostgreSQL locks. I will return to this topic in a future tip. However, to understand the pg_locks view, we need to share some preliminary information on this topic.
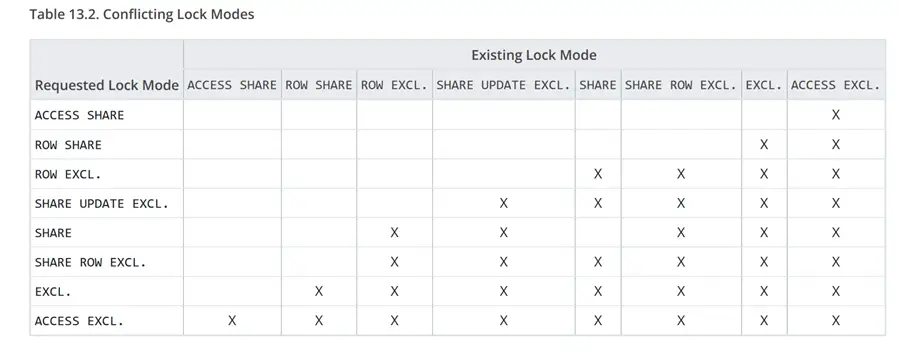
PostgreSQL uses MVCC to ensure concurrency, meaning that reads do not need locks, so we will see all active SELECT queries with “AccessShareLock” mode. Also, with INSERT and DELETE (and UPDATE/MERGE), the locking mode is not totally exclusive and is only at the row level, RowExclusiveLock. In fact, we have row level and page level locks. But, the most exclusive are the table level locks used by DDL modifications, such as ALTER TABLE. Scaling up, the absolute most restrictive of all table locks is ACCESS EXCLUSIVE, used only by DROP and TRUNCATE TABLE, VACUUM FULL, and certain ALTER TABLE commands (not all). This is the only lock that blocks even a SELECT.
The documentation page (Explicit Locking) provides a table (below) with all the conflicting table locks.
Using pg_locks
Back to the pg_locks view, let’s do a simple query on it, while acquiring some locks with another query:
--MSSQLTips.com
do $$
begin
lock table "Album" in exclusive mode;
select pg_sleep(360);
end $$;
Using test database chinook, this query acquires an exclusive lock on the table Album, then we use the pg_sleep function to let it wait.
Now, open another session and try to insert a new row in the table:
--MSSQLTips.com
insert into "Album" ("AlbumId", "Title", "ArtistId" )
values (348,'Live at the Greek', 137);
And in another, do a SELECT on the same table:
--MSSQLTips.com

select *
from "Album";
We can see immediately that the first two queries are waiting while the SELECT returns data. Now, query pg_locks:
--MSSQLTips.com

select relation ::regclass,locktype, mode, granted, waitstart
from pg_locks;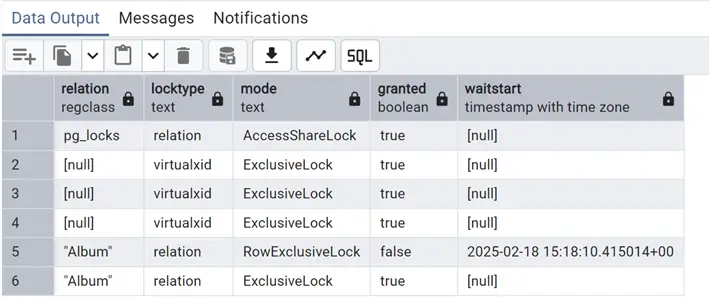
As you can see on the relation (table) “Album,” there are two locks: one granted in exclusive mode that is the one created ad hoc with our first query and one not granted (column granted at false) with row exclusive which is the one attempted by the second query with the insert. With the table locked in exclusive mode, this operation cannot be performed and the column waitstart gives the timestamp indicating how long this query has been waiting.
Using pg_stat_activity and pg_locks
Now, let’s combine these two views, pg_stat_activity and pg_locks, to gather more information. Repeat the query acquiring the exclusive lock and then send an update on the same table, thus creating a lock like before:
--MSSQLTips.com

do $$
begin
lock table "Album" in exclusive mode;
select pg_sleep(360);
end $$;
--MSSQLTips.com
update "Album"
set "Title"='Live at the Greek Vol.1'
where "AlbumId"=348;We can now issue this query combining the two views, using the pid to join the tables:
--MSSQLTips.com

select relation ::regclass,locktype, wait_event_type, wait_event, mode, granted, waitstart
, state,left(query, 100) as short_query, usename
from pg_locks loc
inner join pg_stat_activity act
on loc.pid=act.pid
where wait_event is not null;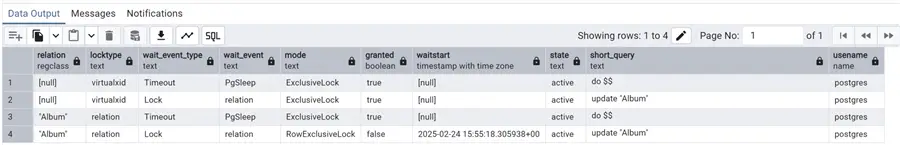
Finally, we have a more complete picture of what is going on in our PostgreSQL cluster.
At this point, let’s go even further by putting together all the information about the blocked session and the session blocking it. Introducing the function pg_blocking_pids(pid), which returns an array of integers with all the blocking pids. As per official documentation, pay attention to the fact that:
“Frequent calls to this function could have some impact on database performance, because it needs exclusive access to the lock manager’s shared state for a short time.”
In other words, this function should not be used freely but only when needed to understand what is blocking the query; otherwise, there may be performance problems.
Let’s simulate a lock again, but this time with two update sessions and one locking the table as before. We issue the following query:
--MSSQLTips.com

with blockers as
(select pid, unnest(pg_blocking_pids(pid)) as blocked_by
from pg_locks
where granted is false)
, lockers as
(select pid, relation ::regclass,locktype, mode, granted, waitstart
from pg_locks
where granted is false)
select blockers.pid as blocked_pid, blocked_by as blocked_by_pid,relation, act.wait_event_type, act.wait_event, mode, waitstart
, left(act.query, 100) as blocked_query, act.usename as blocked_username, actb.wait_event_type||' '||actb.wait_event as wait_blocker, left(actb.query, 100) as blocking_query
,actb.usename as blocking_username
from blockers inner join lockers
on blockers.pid=lockers.pid
inner join pg_stat_activity act
on lockers.pid=act.pid
inner join pg_stat_activity actb
on blockers.blocked_by=actb.pid;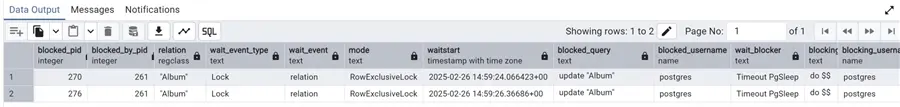
By combining the two aforementioned views and the pg_blocking_pids(pid) function, we gained information about both the blocked and blocking sessions on each row. Please note that to join with the blocking pids, I needed to use the UNNEST array function to have each pid as an integer data type.
Next Steps
In this tip, we reviewed some of the most common monitoring queries used on PostgreSQL, in particular pg_stat_activity and pg_locks system views. In the second part of the tip, we will see the pg_stat_statement extension in action to check query performances, and other ways to monitor PostgreSQL. So stay tuned!!
As always links to the official PostgreSQL documentation:
- pg_stat_activity and also all views for monitoring
- pg_locks
- Cumulative statistic system on how statistics are collected
And some other articles on the monitoring topic:
- SQL Scripts for Monitoring Current Activity, Blocking and Performance
- Troubleshoot Active Sessions in SQL Server vs. Oracle
- Monitoring SQL Server database transaction log space

Andrea Gnemmi is a Database and Data Warehouse professional with almost 20 years of experience, having started his career in Database Administration with SQL Server 2000.
His expertise ranges from SQL Server to Oracle and Postgres for database administration and from SAP BO to SSIS, SSRS and Power BI regarding BI and ETL.
He has worked both in SQL Server and Oracle mostly in multinational environments with very high transaction volumes and large datasets. Performance tuning, indexing techniques and in general Database administration are his hot topics. Ensuring a 24/7 uptime of the various databases in shop is his main responsibility, as well as the best possible performances of all queries run on the databases. He has started working with PostgreSQL two years ago loving many of the features of this RDBMS.
- MSSQLTips Awards: Trendsetter (25+ tips) – 2024 | Rookie of the Year – 2021


