Problem
It seems like every DBA has a USB stick or a shared drive filled with scripts they can pull up in almost any situation. How can I build such a library of T-SQL files?
Solution
This tip is the second in this series. It will contain several scripts I like to use when a SQL Server has a performance problem. Each will come with a short explanation about how to use it. These scripts are being offered as-is without any warranty.
These scripts will not be specific to any one version of SQL Server, but some may not work on legacy versions of SQL Server, such as those that were already end-of-life when this tip was published. Others may not work in cloud installations such as Azure DB or Azure Managed Instance.
What is Running Right Now?
When getting a call that SQL Server is running slowly, one of the first steps is determining what is running right now. One of the best ways to do that is with sp_whoisactive. This differs from sys.sysprocesses because it only shows processes executing a query right now, not idle SPIDs.
Download sp_whoisactive right from the source on GitHub.
EXEC sp_whoisactive;The first column is the duration of the query, so you can avoid looking at queries that have only been running for a fraction of a second.

Read more about how to use sp_whoisactive with these two tips:
Locking and Blocking
Sometimes the issue is blocking. When I suspect blocking, I use these two queries the most:
SELECT * FROM sys.sysprocesses
WHERE blocked > 0
  OR SPID IN (SELECT Blocked FROM sys.sysprocesses);
The column “blocked” shows 0 when a SPID isn’t being blocked and shows the blocking SPID when it is being blocked. This query shows all processes that are blocked or that are blocking someone.
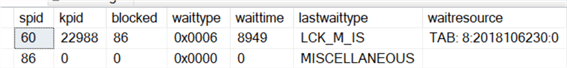
In this example, SPID 60 is being blocked by SPID 86. SPID 86 isn’t being blocked and is the problem process.
Learn about how to handle locking and blocking with these tips:
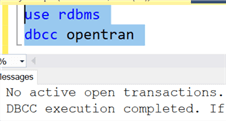
Sometimes a locking problem happens when someone opens an explicit transaction and forgets to close it. Running this command will tell you the oldest open transaction. It’s reasonable for this to return a value from the last few seconds, but if it shows a date/time from several minutes or hours ago, that indicates a problem. Be sure to run this in the context of the database in question.
DBCC OPENTRAN();Here are two sample executions: the first shows an open transaction, and the second shows the output when there are no open transactions.

Read more about DBCC OPENTRAN: Script to find oldest open SQL Server transaction.
Performance Queries
Recent Expensive Queries
Sometimes you get an alert of slow performance, but it clears before you can run sp_whoisactive. Luckily, we can get the plan cache to tell us about recently executed expensive queries.
;WITH qs AS (
  SELECT TOP 10
    total_worker_time/execution_count AvgCPU
  , total_elapsed_time/execution_count AvgDuration
  , (total_logical_reads + total_physical_reads)/execution_count AvgReads
  , execution_count
  , sql_handle
  , plan_handle
  , statement_start_offset
  , statement_end_offset
  FROM sys.dm_exec_query_stats
  WHERE execution_count > 5
    AND min_logical_reads > 100
    AND min_worker_time > 100
  ORDER BY (total_logical_reads + total_physical_reads)/execution_count DESC)
SELECT
  AvgCPU
, AvgDuration
, AvgReads
, execution_count
 ,SUBSTRING(st.TEXT, (qs.statement_start_offset/2) + 1,
            ((CASE qs.statement_end_offset
                WHEN -1 THEN DATALENGTH(st.TEXT)
                ELSE qs.statement_end_offset
              END - qs.statement_start_offset)/2) + 1) StatementText
 ,query_plan ExecutionPlan
FROM
  qs
    CROSS APPLY
  sys.dm_exec_sql_text(qs.sql_handle) AS st
    CROSS APPLY
  sys.dm_exec_query_plan (qs.plan_handle) AS qp
ORDER BY
  AvgDuration DESC;
Wait Stats
SQL Server tracks the waits experienced by every process running on the server. Each wait type starts at 0ms whenever the service is started and counts up from there. To get an idea of what is going on right now, you must compare the numbers from one point in time to another. This script will do just that by comparing the DMV to a snapshot of itself from 15 seconds earlier.
SELECT
  wait_type
, waiting_tasks_count
, signal_wait_time_ms
, wait_time_ms
, SysDateTime() AS StartTime
INTO
  #WaitStatsBefore
FROM
  sys.dm_os_wait_stats
WHERE
  wait_type NOT IN ('SLEEP_TASK','BROKER_EVENTHANDLER','XE_DISPATCHER_WAIT','BROKER_RECEIVE_WAITFOR', 'CLR_AUTO_EVENT', 'CLR_MANUAL_EVENT','REQUEST_FOR_DEADLOCK_SEARCH','SQLTRACE_INCREMENTAL_FLUSH_SLEEP','SQLTRACE_BUFFER_FLUSH','LAZYWRITER_SLEEP','XE_TIMER_EVENT','XE_DISPATCHER_WAIT','FT_IFTS_SCHEDULER_IDLE_WAIT','LOGMGR_QUEUE','CHECKPOINT_QUEUE', 'BROKER_TO_FLUSH', 'BROKER_TASK_STOP', 'BROKER_EVENTHANDLER', 'SLEEP_TASK', 'WAITFOR', 'DBMIRROR_DBM_MUTEX', 'DBMIRROR_EVENTS_QUEUE', 'DBMIRRORING_CMD', 'DISPATCHER_QUEUE_SEMAPHORE','BROKER_RECEIVE_WAITFOR', 'CLR_AUTO_EVENT', 'DIRTY_PAGE_POLL', 'HADR_FILESTREAM_IOMGR_IOCOMPLETION', 'ONDEMAND_TASK_QUEUE', 'FT_IFTSHC_MUTEX', 'CLR_MANUAL_EVENT', 'SP_SERVER_DIAGNOSTICS_SLEEP', 'QDS_CLEANUP_STALE_QUERIES_TASK_MAIN_LOOP_SLEEP', 'QDS_PERSIST_TASK_MAIN_LOOP_SLEEP','CLR_SEMAPHORE','DBMIRROR_WORKER_QUEUE','SP_SERVER_DIAGNOSTICS_SLEEP','HADR_CLUSAPI_CALL','HADR_LOGCAPTURE_WAIT','HADR_NOTIFICATION_DEQUEUE','HADR_TIMER_TASK','HADR_WORK_QUEUE','REDO_THREAD_PENDING_WORK','UCS_SESSION_REGISTRATION','BROKER_TRANSMITTER','SLEEP_SYSTEMTASK','QDS_SHUTDOWN_QUEUE');--These are a series of irrelevant wait stats.

WAITFOR DELAY '00:00:15'; --15 seconds

SELECT
  a.wait_type
, a.signal_wait_time_ms - b.signal_wait_time_ms AS CPUDiff
, (a.wait_time_ms - b.wait_time_ms) - (a.signal_wait_time_ms - b.signal_wait_time_ms) AS ResourceDiff
, a.waiting_tasks_count - b.waiting_tasks_count AS waiting_tasks_diff
, CAST(CAST(a.wait_time_ms - b.wait_time_ms AS FLOAT) / (a.waiting_tasks_count - b.waiting_tasks_count) AS DECIMAL(10,1)) AS AverageDurationMS
, a.max_wait_time_ms max_wait_all_timeMS
, DATEDIFF(ms,StartTime, SysDateTime()) AS DurationSeconds
FROM
  sys.dm_os_wait_stats a
    INNER JOIN
  #WaitStatsBefore b ON a.wait_type = b.wait_type
WHERE
  a.signal_wait_time_ms <> b.signal_wait_time_ms
    OR
  a.wait_time_ms <> b.wait_time_ms
ORDER BY 3 DESC;
For more information, check out this entire tip dedicated to wait stats. You can also watch the recording of this webcast related to troubleshooting common wait types.
IO Subsystem Delay Statistics
SQL Server tracks the delays it experiences when interacting with data and log files. Like wait stats, these counters start at 0 whenever the service is started. This next script will create a temp table to store a snapshot of the numbers, wait 15 seconds, then see what has changed. I usually combine this with the wait stats query, so I only need one delay.
SELECT
  b.name
, a.database_id
, a.[FILE_ID]
, a.num_of_reads
, a.num_of_bytes_read
, a.io_stall_read_ms
, a.num_of_writes
, a.num_of_bytes_written
, a.io_stall_write_ms
, a.io_stall
, GetDate() AS StartTime
INTO
  #IOStatsBefore
FROM
  sys.dm_io_virtual_file_stats(NULL, NULL) a
    INNER JOIN
  sys.databases b ON a.database_id = b.database_id;


WAITFOR DELAY '00:00:15'

SELECT
  a.name DatabaseName
, a.[FILE_ID]
, (b.io_stall_read_ms - a.io_stall_read_ms)/ CAST(1000 as DECIMAL(10,1)) io_stall_read_Diff
, (b.io_stall_write_ms - a.io_stall_write_ms)/ CAST(1000 as DECIMAL(10,1)) io_stall_write_Diff
, (b.io_stall - a.io_stall)/ CAST(1000 as DECIMAL(10,1)) io_stall_Diff
, DATEDIFF(s,StartTime, GETDATE()) AS DurationSeconds
FROM
  #IOStatsBefore a
    INNER JOIN
  sys.dm_io_virtual_file_stats(NULL, NULL) b ON a.database_id = b.database_id AND a.[file_id] = b.[file_id]
ORDER BY
  a.name
, a.[FILE_ID];
Read more about IO issues in these tips:
CPU History
SQL Server natively tracks the CPU utilization history of an instance once per minute for the last 250 minutes. You can get those readings using the following query. If performance is off, compare the last 30 minutes to the 220 before it to see if CPU utilization has increased while the users complained of performance issues.
;WITH XMLRecords AS (
SELECT
         DATEADD (ms, r.[timestamp] - sys.ms_ticks,SYSDATETIME()) AS record_time
       , CAST(r.record AS XML) record
       FROM
         sys.dm_os_ring_buffers r
           CROSS JOIN
         sys.dm_os_sys_info sys
       WHERE
         ring_buffer_type='RING_BUFFER_SCHEDULER_MONITOR'
           AND
         record LIKE '%<SystemHealth>%')
 SELECT
   100-record.value('(./Record/SchedulerMonitorEvent/SystemHealth/SystemIdle)[1]', 'int') AS SystemUtilization
 , record.value('(./Record/SchedulerMonitorEvent/SystemHealth/ProcessUtilization)[1]', 'int') AS SQLProcessUtilization
 , record_time
 FROM XMLRecords;
Memory Metrics
Use the following query to record the page life expectancy of the SQL Server. If you use named instances, your object_name column will need to be modified with the instance name in place of “SQLServer.” Remember — Bigger is better with page life expectancy, but without a baseline, it’s hard to tell what is good versus bad for you.
SELECT
  LEFT(counter_name, 25) CounterName
, CASE counter_name
    WHEN 'Stolen pages' THEN cntr_value/128 --8kb pages/128 = MB
    WHEN 'Stolen Server Memory (KB)' THEN cntr_value/1024 --kb/1024 = MB
    ELSE cntr_value
  END CounterValue_converted_to_MB
FROM
  sys.dm_os_performance_counters
WHERE
  OBJECT_NAME = N'SQLServer:Buffer Manager'
    AND
  counter_name = 'Page life expectancy';
Disk Capacity
Sometimes a full disk can cause a performance problem. Use this query to quickly analyze all logical volumes containing at least one SQL Server data or log file.
SELECT DISTINCT
  vs.volume_mount_point Drive
, vs.logical_volume_name
, vs.total_bytes/1024/1024/1024 CapacityGB
, vs.available_bytes/1024/1024/1024 FreeGB
, CAST(vs.available_bytes * 100. / vs.total_bytes AS DECIMAL(4,1)) FreePct
FROM
  sys.master_files mf
    CROSS APPLY
  sys.dm_os_volume_stats(mf.database_id, mf.file_id) AS vs;
Key Takeaways
- DBAs often create a library of SQL scripts for various situations, aiming to diagnose performance issues.
- The article presents several essential sql monitoring scripts, including sp_whoisactive for checking current queries and identifying blocking issues.
- Key scripts assist in analyzing locking/blocking problems, performance metrics, and wait statistics for SQL Server.
- The scripts cover aspects like CPU history, memory metrics, and disk capacity, highlighting their importance in diagnosing performance problems.
- Overall, these sql monitoring scripts aim to aid DBAs in efficiently resolving SQL Server performance issues.
Next Steps
- Check out these resources:

Eric has been a SQL Server DBA and Architect in the legal, software, transportation, and insurance industries for over 10 years. Currently he is the Sr Data Architect for Squire Patton Boggs, a leading provider of legal services with 47 offices in 20 countries.
Eric is a 2018-2019 Idera Ace and has co-authored 2 Idera Whitepapers.
He has been a presenter at PASS Summit, IT/DevConnections, SQLSaturdays, the in.sight transportation conference, and the Ohio North SQL Server User’s Group.
- MSSQLTips Awards: Author of the Year Contender – 2021, 2022 | Trendsetter (25+ tips) – 2021


Great Tips Greg, I have an issue with the “Memory Metrics” ststement. It returns nothing in spite of the fact that when I open Perf mon I see SQLServer:Buffer Manager
Do you see any data if you run just this
SELECT
LEFT(counter_name, 25) CounterName
, CASE counter_name
WHEN ‘Stolen pages’ THEN cntr_value/128 –8kb pages/128 = MB
WHEN ‘Stolen Server Memory (KB)’ THEN cntr_value/1024 –kb/1024 = MB
ELSE cntr_value
END CounterValue_converted_to_MB
FROM
sys.dm_os_performance_counters
WHERE
OBJECT_NAME = N’SQLServer:Buffer Manager’
You can also use sp_WhoIsActive to track blocked and blocking sessions:
EXEC sp_WhoIsActive
@find_block_leaders = 1,
@sort_order = ‘[blocked_session_count] DESC’
Is it on purpose that the “Recent Expensive Queries” query is partially cut?
Hi Rob, thanks for letting us know the issue. This has been fixed.
Thanks for sharing, useful and great tips
Great job. Thanks.
Great tips! Thank you for sharing!