Overview
SQL Server is usually a high I/O activity process and in most cases the database is larger than the amount of memory installed on a computer and therefore SQL Server has to pull data from disk to satisfy queries. In addition, since the data in databases is constantly changing these changes need to be written to disk. Another process that can consume a lot of I/O is the TempDB database. The TempDB database is a temporary working area for SQL Server to do such things as sorting and grouping. The TempDB database also resides on disk and therefore depending on how many temporary objects are created this database could be busier than your user databases.
Since I/O is such an important part of SQL Server performance you need to make sure your disk subsystem is not the bottleneck. In the old days this was much easier to do, since most servers had local attached storage. These days most SQL Servers use SAN or NAS storage or to further complicate things more and more SQL Servers are running in a virtualized environment.
Explanation
There are several different methods that can be used to track I/O performance, but as mentioned above with SAN / NAS storage and virtualized SQL Server environments, this is getting harder and harder to track as well as the rules have changed as far as what should be tracked to determine if there is an I/O bottleneck. The advantage is that there are several tools available at both the storage level and the virtual level to aid in performance, but we will not cover these here.
There are basically two options that you have to monitor I/O bottlenecks, SQL Server DMVs and Performance Monitor counters. There are other tools as well, but these are two options that will exist in every SQL Server environment.
DMV – sys.dm_io_virtual_file_stats
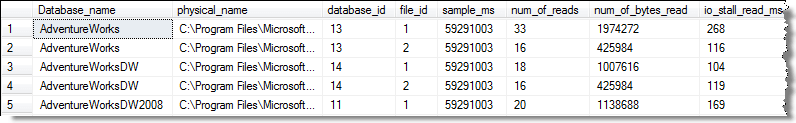
This DMV will give you cumulative file stats for each database and each database file including both the data and log files. Based on this data you can determine which file is the busiest from a read and/or write perspective.
The output also includes I/O stall information for reads, writes and total. The I/O stall is the total time, in milliseconds, that users waited for I/O to be completed on the file. By looking at the I/O stall information you can see how much time was waiting for I/O to complete and therefore the users were waiting.
The data that is returned from this DMV is cumulative data, which means that each time you restart SQL Server the counters are reset. Since the data is cumulative you can run this once and then run the query again in the future and compare the deltas for the two time periods. If the I/O stalls are high compared to the length of the that time period then you may have an I/O bottleneck.
SELECT
cast(DB_Name(a.database_id) as varchar) as Database_name,
b.physical_name, *
FROM sys.dm_io_virtual_file_stats(null, null) a
INNER JOIN sys.master_files b ON a.database_id = b.database_id and a.file_id = b.file_id
ORDER BY Database_Name
Here is partial output from the above command.
Performance Monitor
Performance Monitor is a Windows tool that let’s you capture statistics about SQL Server, memory usage, I/O usage, etc… This tool can be run interactively using the GUI or you can set it up to collected information behind the scenes which can be reviewed at a later time. This tool is found in the Control Panel under Administrative tools.
There are several counters related to I/O and they are located under Physical Disk and Logical Disk. The Physical Disk performance object consists of counters that monitor hard or fixed disk drive on a computer. The Logical Disk performance object consists of counters that monitor logical partitions of a hard or fixed disk drives. For the most part, they both contain the same counters. In most cases you will probably use the Physical Disk counters. Here is a partial list of the available counters.
Now that storage could be either local, SAN, NAS, etc… these two counters are helpful to see if there is a bottleneck:
- Avg. Disk sec/Read is the average time, in seconds, of a read of data from the disk.
- Avg. Disk sec/Write is the average time, in seconds, of a write of data to the disk.
The recommendation is that the values for both of these counters be less than 20ms. When you capture this data the values will be displayed as 0.000, so a value of 0.050 equals 50ms.
Resource Monitor
Another tool that you can use is the Resource Monitor. This can be launched from Task Manager or from the Control Panel.
Below you can see the Disk tab that shows current processes using disk, the active disk files and storage at the logical and physical level. The Response Time (ms) is helpful to see how long it is taking to service the I/O request.

Additional Information
I/O issues may not always be a problem with your disk subsystem. Just because you see a slow down or I/O waits occurring there may be other issues that you need to consider such as missing indexes, poorly written queries, fragmentation or out of date statistics. We will cover these topics as well in this tutorial.
Here are some additional articles about I/O performance.
- Creating IO performance snapshots to find SQL Server performance problems
- Benchmarking SQL Server IO with SQLIO
- How to Identify IO Bottlenecks in MS SQL Server

Greg Robidoux has been working with databases for 35+ years with extensive hands on SQL Server experience from version 6.5 to 2025. He has authored over 250 technical articles and delivered several presentations online and at various conventions. Greg is also the President and founder of Edgewood Solutions, a technology services company delivering services and solutions for Microsoft SQL Server.


Great article!
Thanks for publishing it.