By: Greg Robidoux
Overview
Another useful tool that SQL Server offers is the ability to see query execution plans. An execution plan shows you how SQL Server breaks down a query and also identifies where issues might exist within the execution plan. Once you have identified statements that take a long time to complete, you can then look at the execution plan to determine tuning needs.
Explanation
The Query Execution Plans describe the steps and the order used to access or modify data in the database. Once you have this information you can identify what parts of the query are slow.
SQL Server can create execution plans in two ways:
- Actual Execution Plan - (CTRL + M) - is created after execution of the query and contains the steps that were performed
- Estimated Execution Plan - (CTRL + L) - is created without executing the query and contains an approximate execution plan
Execution plans can be presented in these three ways and each option offers benefits over the other.
- Text Plans
- Graphical Plans
- XML Plans
When beginning to work with execution plans, the graphical plan is usually the easiest place to start unless your plan is very complex, then the text plans are sometimes easier to read.
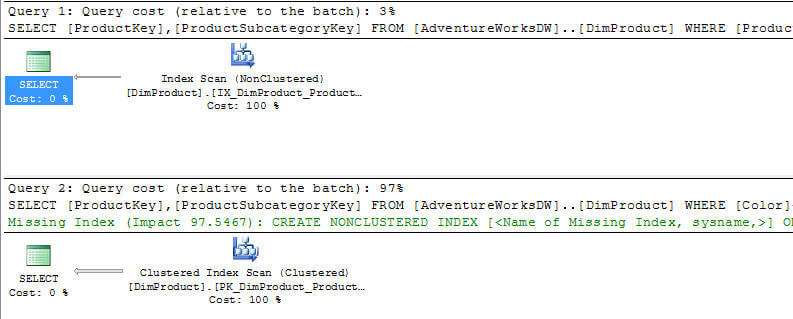
Here is a simple query and its execution plan. To include the Actual Execution Plan press CTRL + M in the query window and then execute the T-SQL code.
-- query 1
SELECT ProductKey,ProductSubcategoryKey
FROM AdventureWorksDW..DimProduct
WHERE ProductKey<100
-- query 2
SELECT ProductKey,ProductSubcategoryKey
FROM AdventureWorksDW..DimProduct
WHERE Color<>'Silver'
Here we can see that query 1 is doing an Index Scan and query 2 is doing a Clustered Index Scan. We can also see that query 1 is 3% of the batch and query 2 is 97%. Also, we can see that SQL Server is recommending that we add a new nonclustered index for query 2. So based on this output we know that query 2 is something that should be addressed.
So you can see that once we have identified what queries are taking a long time using Profiler we can then look at the query execution plan to determine what needs to be tuned to make the query perform better. As with most things the more you use execution plans the easier it gets to identify the issue and what can be done to resolve the issue.
Note that not all execution plans are this simple and sometimes they are very difficult to read and interpret, so for additional information read this tutorial Graphical Query Plan Tutorial.
Additional Information
Here are some additional items related to Execution Plans.
- Graphical Query Plan Tutorial
- SQL Server Query Execution Plans in SQL Server Management Studio
- DiDifferences Between SQL Server Query Plan Formats
- How to read SQL Server graphical query execution plans
- Understanding SQL Server Physical Joins
