Overview
Windows Performance Monitor or PerfMon is another great tool to capture metrics for your entire server. So far we discussed DMVs and Profiler which are great tools for finding out what is occurring within your SQL Server instance, but sometimes there are issues outside of SQL Server that may be causing performance issues. In this section we will take a look at PerfMon and how this tool can be used.
Explanation
The Performance Monitor tool allows you to capture and graph many aspects for the Windows server. There are counters for .NET, Disks, Memory, Processors, Network, etc… as well several counters related to each instance of SQL Server on the box. If you have multiple instances running on one server, the counters are available for each instance so you can see what is occurring at the instance level.
Launching Performance Monitor
You can launch Performance Monitor a few different ways.
Start > Control Panel > Administrative Tools > Performance Monitor or you can launch PerfMon.exe. Once this is running you will get an interface like the following:

Above is the default look and feel when you launch this tool. Here we can see there is one counter “% Processor Time” that is being tracked. For this counter we can see the following items:
- Last – this is the last value that was captured for this counter
- Average – this is the average value for the duration
- Minimum – this is the minimum value for the duration
- Maximum – this is the maximum value for the duration
- Duration – this is the total collection time period and in this case it is 1:40 which is 1 minute and 40 seconds
From this we can tell when there are peaks for specific counters that may be causing performance issues.
Adding Counters and Changing Settings
To add a counter, right click on the big green plus button above the graph and a new window will open like the following:
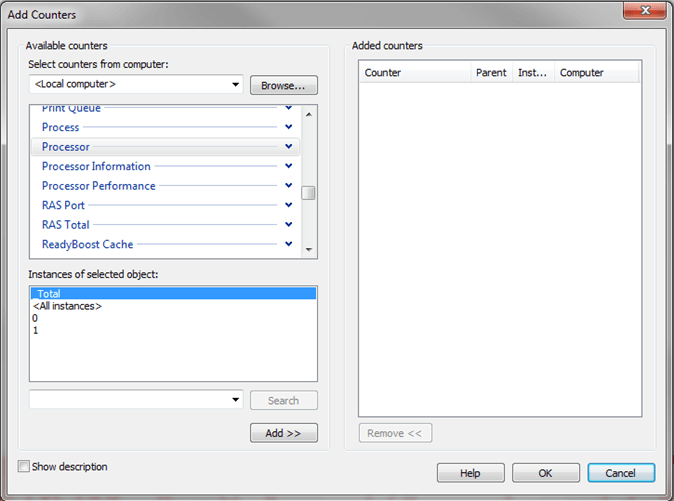
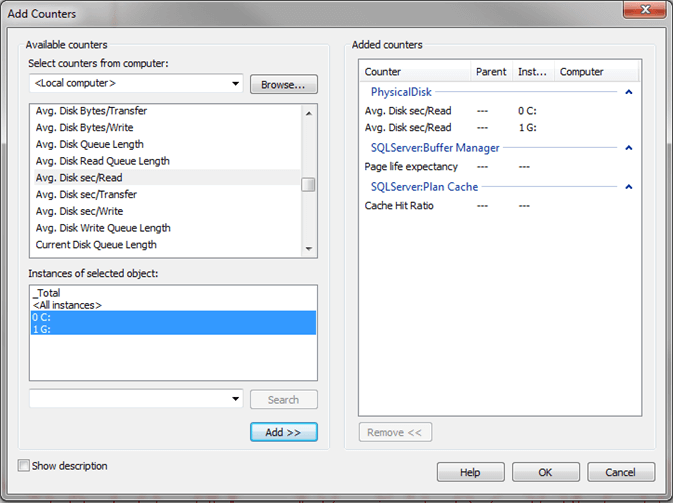
From this window we can select additional counters such as Memory, Physical Disk and SQL Server specific counters. To add a counter select the counter and click the Add button. The below screen shot shows multiple counters that have been selected. Click OK when you are done to start capturing this data.
The other thing you will want to do is change your duration and frequency for collecting data. By default it is set to sample the data every 1 second for a duration of 100 seconds. To change this right click on the graph and select Properties and a new window like the following will appear. If you click on the General tab you can set the sampling settings as shown below. In addition there are several other properties you can modify in this window.
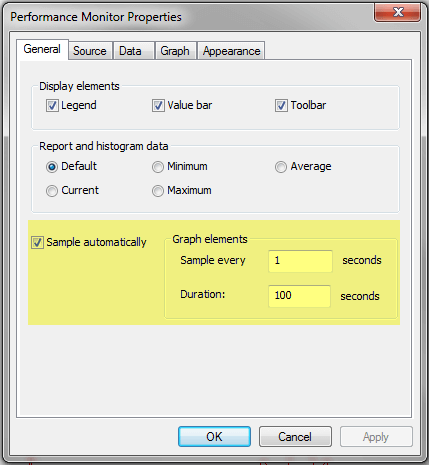
Once you click OK these settings will go in to effect immediately.
Useful Counters
Once you start to explore all of the counters it can be overwhelming since there are so many to choose from, so here are a few counters that would make sense to begin capturing. Also, once you start collecting it is also difficult to tell if you have an issue or not based on the values that are returned. Since there are no hard and fast rules for all counters the best approach is to capture these values when your system is running fine, so you can create a baseline. Then you can use these baseline numbers when you start to capture data. You can find some information online about specific counters and threshold values for each counter.
- Memory
- Available MBytes
- Physical Disk
- Avg. Disk sec/Read
- Avg. Disk sec/Write
- Processor
- % Processor Time
- SQL Server: Buffer Manager
- Page Life Expectancy
- Buffer cache hit ratio
- SQL Server: SQL Statistics
- Batch Requests/sec
- Compilations/sec
Additional Information
Here are some additional items related to Performance Monitor.
- Automate Performance Monitor Statistics Collection for SQL Server and Windows
- Setup Performance Monitor to always collect SQL Server performance statistics
- Free Microsoft Tools to Help Setup and Maintain PerfMon for SQL Server

Greg Robidoux has been working with databases for 35+ years with extensive hands on SQL Server experience from version 6.5 to 2025. He has authored over 250 technical articles and delivered several presentations online and at various conventions. Greg is also the President and founder of Edgewood Solutions, a technology services company delivering services and solutions for Microsoft SQL Server.