By: Greg Robidoux
Overview
In order for SQL Server to maintain data integrity for both reads and writes it uses locks, so that only one process has control of the data at any one time. There are serveral types of locks that can be used such as Shared, Update, Exclusive, Intent, etc... and each of these has a different behavior and effect on your data.
When locks are held for a long period of time they cause blocking, which means one process has to wait for the other process to finish with the data and release the lock before the second process can continue. This is similar to deadlocking where two processes are waiting on the same resource, but unlike deadlocking, blocking is resolved as soon as the first process releases the resource.
Explanation
As mentioned above, blocking is a result of two processes wanting to access the same data and the second process needs to wait for the first process to release the lock. This is how SQL Server works all of the time, but usually you do not see blocking because the time that locks are held is usually very small.
It probably makes sense that locks are held when updating data, but locks are also used when reading data. When data is updated an Update lock is used and when data is read a Shared lock is used. An Update lock will create an exclusive lock on the data for this process and a Shared lock allows other processes that use a Shared lock to access the data as well and when two processes are trying to access the same data this is where the locking and blocking occurs.
Here are various ways you can identify blocking for your SQL Server instance.
sp_who2
In a query window run this command:
This is the output that is returned. Here we can see the BlkBy column that shows SPID 60 is blocked by SPID 59.

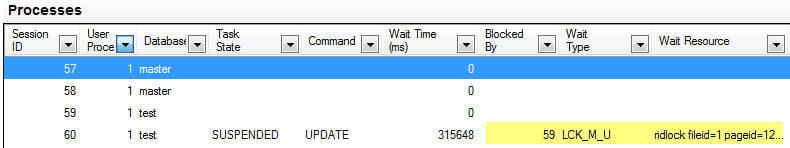
Activity Monitor
In SSMS, right click on the SQL Server instance name and select Activity Monitor. In the Processes section you will see information similar to below. Here we can see similar information as sp_who2, but we can also see the Wait Time, Wait Type and also the resource that SPID 60 is waiting for.
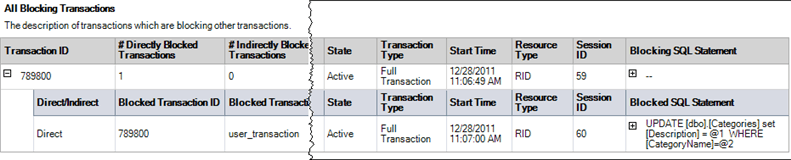
Report - All Blocking Transactions
Another option is to use the built in reports in SSMS. Right click on the SQL Server instance name and select Reports > Standard Reports > Activity - All Block Transactions.
Querying Dynamic Management Views
You can also use the DMVs to get information about blocking.
SELECT session_id, command, blocking_session_id, wait_type, wait_time, wait_resource, t.TEXT
FROM sys.dm_exec_requests
CROSS apply sys.dm_exec_sql_text(sql_handle) AS t
WHERE session_id > 50
AND blocking_session_id > 0
UNION
SELECT session_id, '', '', '', '', '', t.TEXT
FROM sys.dm_exec_connections
CROSS apply sys.dm_exec_sql_text(most_recent_sql_handle) AS t
WHERE session_id IN (SELECT blocking_session_id
                    FROM sys.dm_exec_requests
                    WHERE blocking_session_id > 0)
Here is the output and we can see the blocking information along with the TSQL commands that were issued.

Additional Information
Here are some additional artilces about blocking.
- How to identify blocking in SQL Server 2005 and 2008
- Understanding SQL Server Blocking
- Understanding SQL Server Locking
- Understanding the SQL Server NOLOCK hint
- Using SQL Server Indexes to Bypass Locks
- Execute SQL Server SELECT command without locking
