Problem
I get so frustrated when trying to determine where to start when a user comes to me and tells me that “the database is slow”. Launching Performance Monitor and running a trace in Profiler is inefficient. Unless I know what I’m looking for to begin with it’s hard to narrow things down using those tools! Do you have any suggestions for quickly determining if I should be looking at CPU, Memory, or I/O issues without the needle v. haystack dilemma that comes with diving right in to Perfmon and Profiler?
Solution
There is definitely a better option to quickly determining where you should spend your performance tuning resources on when encountering a “slow database”. It’s also associated with my favorite SQL Server subject: Dynamic Management Views. There is a specific DMV that you can quickly query to determine if you’re dealing with CPU, Memory, or Disk (I/O) issues: sys.dm_os_wait_stats. Every time SQL Server is forced to wait for a resource it records the wait. Yes, just like all your exes, SQL Server holds a grudge as well! You can query this listing of wait instance via the sys.dm_os_wait_stats DMV. The column list for that DMV is shown below:
- wait_type – the type of wait being encountered, the current list of wait types is available from Microsoft here. There are currently 201 wait types in SQL Server 2005; 485 in SQL Server 2008 as of SP1.
- waiting_tasks_count – the cumulative number of tasks that have registered this wait since the last time SQL Server services were restarted.
- wait_time_ms – the cumulative amount of wait time registered for all tasks encountering this type of wait since the SQL Server services were restarted.
- max_wait_time_ms – the maximum wait time for any of the tasks encountering this wait since last SQL Server service restart.
- signal_wait_time_ms – the amount of time, in milliseconds, any request waited after being signaled that the resource was freed, until a worker was assigned to handle the request. A high signal wait time is indicative of CPU issues in that the thread still had to wait for CPU assignment even after the resource being waited on was freed up.
I made mention above that the information is cumulative for this DMV. This information is held in cache. It will be lost/reset upon services restart. If you want to maintain history for this metadata you may want to consider persisting the information in a physical table. More about that later in this tip though.
So, what does the data from this DMV look like? Let’s see some of the results based upon a simple SELECT *… query:
SELECT * FROM sys.dm_os_wait_stats;

Looking at the sample output you’ll see that results are returned for each wait_type, regardless of whether or not there were any cumulative tasks that waited on resources for that specific type. You can also see that lock types are included in the output of sys.dm_os_wait_stats. A general query of this type doesn’t really tell us much though. It’s the other things we can do with this DMV that are telling.
Glenn Berry, in his chapter on DMVs in the recent MVP Deep Dive Book, had a great query that utilizes sys.dm_os_wait_stats. I’ve taken that query and altered it slightly for my use to get a snapshot of waits in percentage form at the current point in time. By creating a common table expression to build a Waits table you can filter out irrelevant wait types and then look at a listing of just those waits that comprise the top N% (in this case 95%) of the waits on the SQL Server instance:
WITH Waits AS
 (
 SELECT
   wait_type,
   wait_time_ms / 1000. AS wait_time_s,
   100. * wait_time_ms / SUM(wait_time_ms) OVER() AS pct,
   ROW_NUMBER() OVER(ORDER BY wait_time_ms DESC) AS rn
 FROM sys.dm_os_wait_stats
 WHERE wait_type
   NOT IN
     ('CLR_SEMAPHORE', 'LAZYWRITER_SLEEP', 'RESOURCE_QUEUE',
   'SLEEP_TASK', 'SLEEP_SYSTEMTASK', 'SQLTRACE_BUFFER_FLUSH', 'WAITFOR',
   'CLR_AUTO_EVENT', 'CLR_MANUAL_EVENT')
   ) -- filter out additional irrelevant waits

SELECT W1.wait_type,
 CAST(W1.wait_time_s AS DECIMAL(12, 2)) AS wait_time_s,
 CAST(W1.pct AS DECIMAL(12, 2)) AS pct,
 CAST(SUM(W2.pct) AS DECIMAL(12, 2)) AS running_pct
FROM Waits AS W1
 INNER JOIN Waits AS W2 ON W2.rn <= W1.rn
GROUP BY W1.rn,
 W1.wait_type,
 W1.wait_time_s,
 W1.pct
HAVING SUM(W2.pct) - W1.pct < 95; -- percentage threshold;

In this case you’ll see that since the last SQL Server services restart, I’m primarily dealing with ASYNC_NETWORK_IO and OLEDB waits on my SQL Server instance. I know there to be issues with a specific application on my server that causes these waits due to performing row-by-row processing of SQL batch results sets returned to the application. The SOS_SCHEDULER_YIELD wait occurs whenever a task offers up its place in queue to allow another process to run in its stead. It is indicative of CPU issues that may need to be addressed. Specific waits will point you in the direction of where to focus your tuning resources because the cause for certain waits are attributed directly to CPU, memory, or I/O. The PAGEIOLATCH_… waits are indicative of I/O issues, as is WRITELOG. CXPACKET is an indicator of waits due to queries going parallel and running across a number of CPU cores. I strongly suggest following the Microsoft CSS Team’s blog and reading through the number of entries associated with wait types for the continual evolution of precision tuning using sys.dm_os_wait_stats.
The important thing to remember is that the metrics for the columns returned when querying sys.dm_os_wait_stats is cumulative. Like all Dynamic Management Object information these values accumulate over time and are wiped-clean at a SQL Server service restart. This is why I mentioned persisting the information in a static table on a dedicated administrative database located on each managed SQL Server instance. You can then query the information just for the period between the last two stats collections. I use a SQL Server Agent job that runs hourly to persist the information to the static table. You could either run the code manually when desired or schedule as works best in your organization. The query is lightweight, not really too noticeable on a decently-sized server. The template script below will allow you to do just that. Note that the remaining scripts in this post use template notation. CTRL+SHIFT+M in SQL Server Management Studio will provide a form to enter parameter values that are correct for your environment.
USE [<database_name,,Foo>];
--Create table to persist wait stats information:
CREATE TABLE <table_schema_name,,dbo>.<table_name,,dm_os_wait_stats>
(
 [wait_type] [nvarchar](60) NOT NULL,
 [waiting_tasks_count] [bigint] NOT NULL,
 [wait_time_ms] [bigint] NOT NULL,
 [max_wait_time_ms] [bigint] NOT NULL,
 [signal_wait_time_ms] [bigint] NOT NULL,
 [capture_time] [datetime] NOT NULL,
 [increment_id] [int] NOT NULL
);
ALTER TABLE <table_schema_name,,dbo>.<table_name,,dm_os_wait_stats>
 ADD  DEFAULT (GETDATE()) FOR [capture_time];
--Insert wait stats info in a datestamped format for later querying:
DECLARE @DT DATETIME ;
SET @DT = GETDATE() ;
DECLARE @increment_id INT;
SELECT @increment_id = MAX(increment_id) + 1 FROM <table_schema_name,,dbo>.<table_name,,dm_os_wait_stats>;
SELECT @increment_id = ISNULL(@increment_id, 1)

INSERT INTO <database_name,,Foo>.<table_schema_name,,dbo>.<table_name,,dm_os_wait_stats>
 ([wait_type], [waiting_tasks_count], [wait_time_ms], [max_wait_time_ms],
 [signal_wait_time_ms], [capture_time], [increment_id])
SELECT [wait_type], [waiting_tasks_count], [wait_time_ms], [max_wait_time_ms],
 [signal_wait_time_ms], @DT, @increment_id
FROM sys.dm_os_wait_stats;
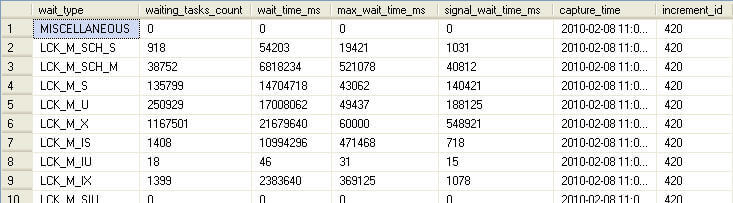
The following information would be persisted to the physical table of your choosing. If using the defaults in the template it would be Foo.dbo.dm_os_wait_stats. Note how it creates and increment_id and datestamp for the data collected:
Then you can run a query similar to this and only view counts resulting from recent activity – not activity over days, months, weeks, etc (trailing columns removed from screen shot for space concerns):
--Return persisted information from table
USE [<database_name,,Foo>];
DECLARE @max_increment_id INT
------------------------------------------------------------------
--Determine most-recent increment_id
------------------------------------------------------------------
SELECT @max_increment_id = MAX(increment_id)
FROM <table_schema_name,,dbo>.<table_name,,dm_os_wait_stats>

------------------------------------------------------------------
--Present Waits results for period
------------------------------------------------------------------
SELECT DOWS1.wait_type,
 (DOWS1.waiting_tasks_count - DOWS2.waiting_tasks_count) AS [waiting_tasks_count],
 (DOWS1.wait_time_ms - DOWS2.wait_time_ms) AS [wait_time_ms],
 DOWS1.max_wait_time_ms,
 (DOWS1.signal_wait_time_ms - DOWS2.signal_wait_time_ms) AS [signal_wait_time_ms],
 DATEDIFF(ms, DOWS2.capture_time, DOWS1.capture_time) AS [elapsed_time_ms],
 DOWS1.capture_time AS [last_time_stamp], DOWS2.capture_time AS [previous_time_stamp]
FROM
 (
 SELECT  wait_type, waiting_tasks_count, wait_time_ms, max_wait_time_ms,
         signal_wait_time_ms, capture_time, increment_id
 FROM <table_schema_name,,dbo>.<table_name,,dm_os_wait_stats>
 WHERE increment_id = @max_increment_id
 )AS DOWS1
 INNER JOIN
 (
 SELECT  wait_type, waiting_tasks_count, wait_time_ms, max_wait_time_ms,
         signal_wait_time_ms, capture_time, increment_id
 FROM <table_schema_name,,dbo>.<table_name,,dm_os_wait_stats>
 WHERE increment_id = (@max_increment_id - 1)
 )AS DOWS2 ON DOWS1.wait_type = DOWS2.wait_type
WHERE (DOWS1.wait_time_ms - DOWS2.wait_time_ms) > 0
 /*
 This can technically be eliminated because we're not persisting these waits:
 AND DOWS1.wait_type NOT IN
   ('CLR_SEMAPHORE', 'LAZYWRITER_SLEEP', 'RESOURCE_QUEUE',
   'SLEEP_TASK', 'SLEEP_SYSTEMTASK', 'SQLTRACE_BUFFER_FLUSH', 'WAITFOR',
   'CLR_AUTO_EVENT', 'CLR_MANUAL_EVENT')
 */
ORDER BY (DOWS1.wait_time_ms - DOWS2.wait_time_ms) DESC;

Finally, you could re-tool the earlier top N% waits query to examine just the most recent wait stats activity from the persisted table as demonstrated below. You can utilize this process (building a CTE comparing deltas for just the activity collected since the last two polling periods) to retrofit any query you find online for analyzing results from sys.dm_os_wait_stats.
--wait_stats as percentage just for current collection period:
USE [<database_name,,Foo>];
DECLARE @max_increment_id INT
------------------------------------------------------------------
--Determine most-recent increment_id
------------------------------------------------------------------
SELECT @max_increment_id = MAX(increment_id)
FROM <table_schema_name,,dbo>.<table_name,,dm_os_wait_stats>;

------------------------------------------------------------------
--Present Waits results for period
------------------------------------------------------------------
WITH Waits AS
 (
 SELECT DOWS1.wait_type,
   ((DOWS1.wait_time_ms - DOWS2.wait_time_ms)/1000) AS [wait_time_s],
   100. * (DOWS1.wait_time_ms - DOWS2.wait_time_ms) / SUM(DOWS1.wait_time_ms - DOWS2.wait_time_ms) OVER() AS pct,
     ROW_NUMBER() OVER(ORDER BY (DOWS1.wait_time_ms - DOWS2.wait_time_ms) DESC) AS rn
 FROM
   (
   SELECT  wait_type, waiting_tasks_count, wait_time_ms, max_wait_time_ms,
      signal_wait_time_ms, capture_time, increment_id
   FROM <table_schema_name,,dbo>.<table_name,,dm_os_wait_stats>
   WHERE increment_id = @max_increment_id
   )AS DOWS1
   INNER JOIN
   (
   SELECT  wait_type, waiting_tasks_count, wait_time_ms, max_wait_time_ms,
      signal_wait_time_ms, capture_time, increment_id
   FROM <table_schema_name,,dbo>.<table_name,,dm_os_wait_stats>
   WHERE increment_id = (@max_increment_id - 1)
   )AS DOWS2 ON DOWS1.wait_type = DOWS2.wait_type
 WHERE (DOWS1.wait_time_ms - DOWS2.wait_time_ms) > 0
 )

SELECT W1.wait_type,
 CAST(W1.wait_time_s AS DECIMAL(12, 2)) AS wait_time_s,
 CAST(W1.pct AS DECIMAL(12, 2)) AS pct,
 CAST(SUM(W2.pct) AS DECIMAL(12, 2)) AS running_pct
FROM Waits AS W1
 INNER JOIN Waits AS W2 ON W2.rn <= W1.rn
GROUP BY W1.rn,
 W1.wait_type,
 W1.wait_time_s,
 W1.pct
HAVING SUM(W2.pct) - W1.pct < 95; -- percentage threshold;

Next Steps
- As you encounter performance tuning issues, consider the scripts in this tip to begin to refine your scope to solve the issues.
- Follow the Microsoft CSS Team’s Blog here.
- The concept of Dynamic Management Objects was mentioned in this tip. Tips about DMVs are available here.
- Check out these related tips:

Tim Ford is a Senior Database Administrator with MindBody in San Luis Obispo, California and is in the process of relocating west to the Pacific Northwest from Michigan. Since 2010 he’s produced Microsoft Data Platform training events branded as SQL Cruise from Alaska to the Caribbean and the Mediterranean at Tech Outbound, an events company specializing in technical training in unconventional locations. His SQL Cruise events take place on cruise ships in the Caribbean, Alaska, and the Mediterranean. Tim also is the Executive VP of Marketing for PASS, the global association for Microsoft data professionals. He also is a contributing author for itprotoday. Tim loves helping people find their true potential through education and building networks between Thought Leaders in various fields and those who are just starting on their careers or struggling to find their footing in established careers. If you’re looking for this sort of experience then check out the next SQL Cruise event taking place this August in Seattle.
- MSSQLTips Awards: Acheiver (75+ tips) – 2010