Problem
We are in the process of building a data warehouse in Microsoft Fabric. Since we have good knowledge of T-SQL, we are using Fabric Warehouse as the database engine. We are hitting some performance issues in our ETL and we would like to investigate further, but traditional SQL Server DMVs don’t give the results we are hoping for. How can we troubleshoot performance in the Fabric Warehouse?
Solution
The Microsoft Fabric Warehouse is a highly scalable database engine for analytical workloads, operating on top of delta tables (which is a transaction layer on top of Parquet files). It behaves like a regular transactional database, and it uses T-SQL as its query language (albeit with some limitations). Even though it looks and feels like SQL Server, there are some discrepancies and especially when it comes to troubleshooting slow queries.
SQL Server Tools Not in Fabric Warehouse
Here is a look at some of the things often used for performance tuning of queries.
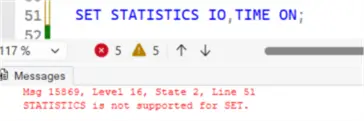
SET STATISTICS not supported
For example, you cannot use SET STATISTICS to retrieve detailed CPU/query timings or number of pages scanned.
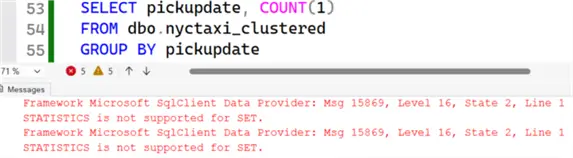
Actual Execution Plan not supported
Another issue is that showing the actual execution plan is also not supported:
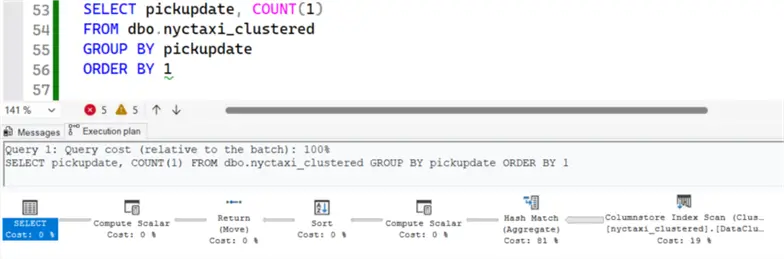
Estimated Execution Plan is supported
Luckily, it’s possible to show the estimated execution plan:
Dynamic Management Views not supported
However, to efficiently do performance tuning, we need more information like CPU consumed or how much data was scanned. In SQL Server, you can use dynamic management views (DMV) such as sys.dm_exec_query_stats to get more details. But these are – again – not supported.

It’s possible to execute some of the available DMVs, but they don’t return any useful data. The following query is written by query tuning expert Pinal Dave:
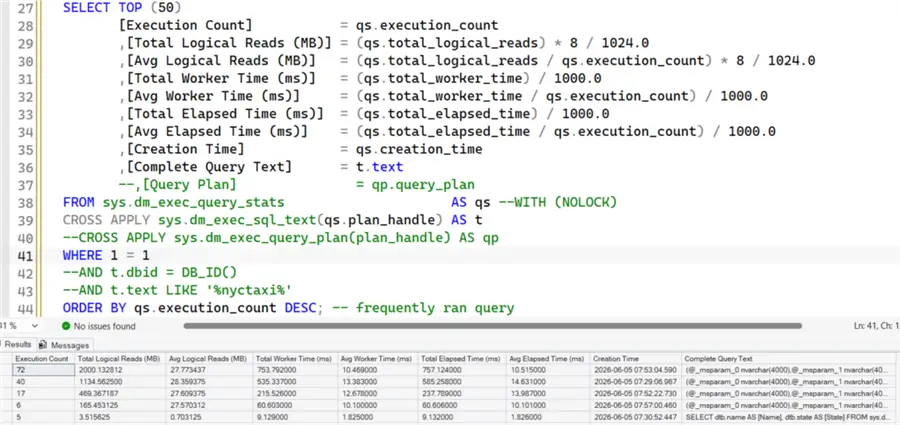
The result set only includes data from system queries. If we filter for our own user queries, no data is returned (except the DMV query itself):

Some DMVs like sys.dm_exec_query_plan give an error when used.

This means that a lot of queries you find online when searching for query tuning advice (for example on blogs like the one from Pinal, or sites like Stack Overflow, or suggestions from AI even) don’t work in the Fabric Warehouse.
Fabric Warehouse Query Insights
So how can we check for performance info? The Fabric Warehouse comes with a set of easy-to-use views – stored in a schema named query insights – that return the data we need to investigate slow queries.
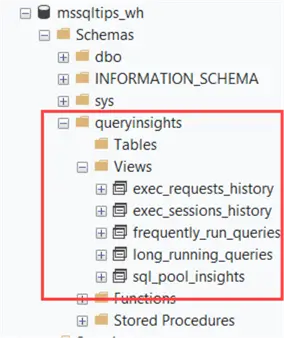
In this tip, we’ll take a look at the query insight views and show you how we can use them to verify if a query has improved in performance or not.
Fabric Warehouse Query Insights
There are currently 5 query insight views offered out of the box:
exec_requests_history
This view returns information about each completed SQL request. It returns many columns with interesting information, such as start and end time, the statement type (SELECT, UPDATE, DELETE or INSERT), the row count, the status (succeeded, failed or cancelled), session ID, an indicator if the result set cache was used, the SQL pool used, the number of bytes scanned from remote/local storage or memory, and the actual SQL statement itself.
This view is probably the most interesting when it comes to performance tuning individual statements.
exec_sessions_history
This view gives more information about each completed session. It contains columns about the login, the session ID, the status (succeeded, killed or failed), the different SET options (like arithabort, ansi_warnings, ansi_defaults etc.), the transaction isolation level, the number of open transactions, the total elapsed time, time of the last request and so on.
This view is useful for debugging long running sessions, auditing who connected to the warehouse, tuning long stored procedures etc.
long_running_queries
as the name implies, info about long running queries is returned. This includes the last start time, the last command, the median/total elapsed time, the number of rows, and the query hash. There are significantly less columns than in the previous two views, but this query insights view serves a more specific purpose.
frequently_run_queries
This is similar to the previous view, but this time more focused on the number of times a query has run. It has info about the average/min/max elapsed time, the number of total runs, but also the number of runs that was successful, failed or cancelled.
sql_pool_insights
This is the latest addition to query insights. You can use this view to monitor SQL Pool health, investigate performance bottlenecks (by checking the maximum resource percentage), verify if the pool is under pressure, and if pressure has had an impact on poor performing queries. This last part can be important, because you can have a well-written query perform badly simply because there were not enough resources.
This view becomes more important with the introduction of custom SQL Pools for the Warehouse, which are in preview at the time of writing.
Example Use of Query Insights
Let’s illustrate the usefulness of the query insights view with a practical example. In the tip Improve Query Performance in the Fabric Warehouse with Clustering w we investigated if clustering a table on some columns would improve the performance of certain queries. We could verify if a query had actually improved in performance by checking the execution statistics of the same query executed on a table without clustering, and executed on a table with clustering.
Closer look at exec_requests_history
The following query was used, which makes use of the exec_requests_history view:
-- MSSQLTips.com
SELECT
     start_time
    ,end_time
    ,[is_distributed]
    ,statement_type
    ,command
    ,total_elapsed_time_ms
    ,row_count
    ,[status]
    ,[result_cache_hit]
    ,allocated_cpu_time_ms
    ,data_scanned_remote_storage_mb
    ,data_scanned_memory_mb
    ,data_scanned_disk_mb
FROM queryinsights.exec_requests_history
WHERE   1               = 1
    AND database_name   = 'mssqltips_wh'
    AND statement_type  = 'SELECT'
    AND command         NOT LIKE '%queryinsights%'
    AND program_name    <> 'Microsoft SQL Server Management Studio - Transact-SQL IntelliSense'
    AND command         LIKE '%nyctaxi%'
ORDER BY submit_time DESC;
Make sure to run the query on the correct database. Even though we filter on the database_name column, executing the same script on another warehouse in your Fabric workspace will return other results. We are only interested in SELECT statements, which we can specify through a filter on the statement_type column. We are specifically interested in queries that include the nyctaxi tables. To filter out “false positives”, we’re excluding the following queries:
- those that include “queryinsights” (otherwise the query above would be returned as well)
- those that are executed by the SSMS IntelliSense tool
- optionally queries on sys.dm_exec_query_stats (as shown in the introduction)
This returns the following dataset:

If we zoom in a bit, we can see that the query from the 2nd row is on a clustered table, and the one from the 3rd row is the same query on a nonclustered table.

The clustered query has about 1/5th of the total elapsed time in milliseconds (and similar in allocated CPU time), and had to read significantly less data (only 9MB compared to 307MB).
Next Steps
- To learn more about how you can tune queries with SET STATISTICS in SQL Server, check out the following tips:
- You can find all Fabric tips in this overview.
- If you’re interested in SQL Server performance tuning, you can use this useful checklist.

Koen Verbeeck is a seasoned business intelligence consultant with over a decade of experience with the Microsoft Data Platform. He holds several certifications, including Azure Data Engineer. He’s a prolific writer, with over 375 articles on technologies such as Microsoft Fabric, SSIS, ADF, SSAS, SSRS, MDS, Power BI, Snowflake and Azure services. He has spoken at various events such as PASS, SQLBits, dataMinds Connect and many others. He frequently delivers educational webinars on MSSQLTips.com. For his efforts, Koen has been awarded the Microsoft MVP data platform award for many years.
- MSSQLTips Awards:
- Leadership Award (200+ Tips) – 2021
- Author of the Year – 2014/2020/2022
- Author Contender – 2024/2025