By: Rick Dobson | Comments (2) | Related: > Query Optimization
Problem
Please demonstrate the basics of how to use the set statistics io statement to tune SQL Server queries. Provide a framework for invoking the statement and a summary of its key outputs. Also, present several examples of interpreting output from the statement to tune SQL Server queries. Finally, show how the query cost output reported with execute plan diagrams can help confirm tuning conclusions based on the set statistics io statement.
Solution
This tip focuses on tuning queries with the set statistics io statement. This statement draws a distinction between physical reads and logical reads as well as data scans. Physical reads focus on transferring data from disk storage to memory in a data cache (sometimes called a data buffer pool). Logical reads refer to reads from the data cache. SQL Server builds an execution plan for data only after it is transferred from disk storage to the data cache. Scans refer to how many times data are scanned or searched for a specific query after they are transferred from disk storage to memory. The statistics generated by the set statistics io statement pertain to physical reads, logical reads, and scans of data.
You may be familiar with examining execution plans as a tool for drilling down on how to expedite query performance, but a prior tip indicates that access to execution plans can be disallowed for some DBAs on some database servers. In these cases, using the set statistics io statement can provide some information useful for tuning queries. Even if a SQL Server professional does have execution plan permission, which is known as showplan permission, the set statistics io statement can still provide valuable information for tuning queries not available from the execution plan.
A framework for set statistics io
The following short script presents a framework consisting of pseudo code and comments for deriving io statistics for T-SQL queries that return results sets. It is often possible to generate a results set with two or more different T-SQL query designs. By comparing the io statistics from each query design, you can develop an understanding of which of them puts the lightest read and scan load on a server.
- The code begins with a use statement to designate a default database context.
- Next, dbcc dropcleanbuffers and checkpoint statements save data buffer pages and clear the data buffers of contents from prior io statistics assessments. These statements allow you to test a query with a cold data buffer pool without having to shut down and restart the server. Using dbcc dropcleanbuffers on a production server can adversely affect performance.
- Before running a sql statement for which you want to assess io statistics, invoke the set statistics io on statement.
- Next, run the sql statement for which you want io statistics.
- After running the sql query statement, you can turn the io statistics assessment capability off with a set statistics io off statement.
-- a framework for using the set statistics io statement

use statement that specifies a default database context
go

-- clean and then clear dirty data buffers
dbcc dropcleanbuffers;
checkpoint;

-- turn set statistics io on
set statistics io on

-- T-SQL query statement to be tuned
T-SQL query statement with reads and scans to be optimized

-- turn set statistics io on
set statistics io off
A summary of io statistics available from set statistics io
The following table names and describes the io statistics reported by the set statistics io statement in SQL Server 2019. You can compare two T-SQL query statements by examining the reported statistics for two consecutive runs of the set statistics io framework. When a query references two or more tables, you may find it useful to derive io statistics separately for each referenced table as well as the combined set of all tables in the source for a query.
If you have two different query statements that generate the same results set, the query with the fewest number of reads is the optimized design. You should also focus on adopting query statements that minimize physical reads relative to logical reads. This is because physical reads collect data pages from a storage device while logical reads collect pages for a query from the data cache in memory. It is faster to collect pages from memory than disk.
| Io statistic name | Io statistic description |
|---|---|
| Scan count | Number of seeks or scans started to retrieve all the values to construct the final dataset for the output. |
| logical reads | A read of a data page from memory. |
| physical reads | A read of a data page from disk when it is not available in memory. |
| page server reads | Refers to the transfer of a page from disk to the data buffer in memory. The page server reads per second reflects the number of page reads across all databases. |
| read-ahead reads | A read ahead read transfers a data page from disk to memory before it is specifically requested. |
| page server read-ahead reads | Refers to the transfer of a page from disk to the data buffer in memory before it is specifically requested. Reflects read-ahead read throughput in the same way that page server reads reflect physical reads. |
| lob logical reads | Logical reads for text, ntext, image, varchar(max), nvarchar(max), varbinary(max), or columnstore index pages. |
| lob physical reads | Physical reads for text, ntext, image, varchar(max), nvarchar(max), varbinary(max), or columnstore index pages. |
| lob page server reads | Refers to the transfer of a text, ntext, image, varchar(max), nvarchar(max), varbinary(max), or columnstore index pages from disk to the data buffer in memory across all databases. |
| lob read-ahead reads | Refers to read-ahead reads for text, ntext, image, varchar(max), nvarchar(max), varbinary(max), or columnstore index pages. |
| lob page server read-ahead reads | Refers to the transfer of a text, ntext, image, varchar(max), nvarchar(max), varbinary(max), or columnstore index pages from disk to the data buffer in memory before it is specifically requested across all databases. |
Impacts of table size and reading from buffer on io statistics
Queries run more efficiently in SQL Server when they reference fewer pages. This is because it takes more resources to read many pages than a smaller set of pages. Also, queries run more efficiently when they read data from memory instead of from disk storage. This is because it is faster to retrieve data from memory than disk storage.
The following T-SQL script confirms these design guidelines with io statistics.
- A use statement sets WideWorldImporters as the default database. This database is available for download from the Microsoft Docs site.
- Three pairs of set statistics io on and off statements return io statistics.
- The first query counts the number of rows in the Cities table within the Application schema. This query is preceded by dbcc dropcleanbuffers and checkpoint statements so there are no dirty pages in the data cache in memory. A dirty page is a page in memory with updates that have not been committed to disk. There are tens of thousands of cities in the Cities table.
- The second query is the same as the first query. However, because the io statistics from this query run after the first query without intermediate statements to clean and clear the data cache, the data that the query needs to perform the count is already in memory. In other words, there is no need to transfer the data from disk storage to memory before counting the rows in the Cities table.
- The third query has the same design as the first query, except it counts the rows in the StateProvinces table within the Application schema. This table has fifty-three rows – one for each of fifty states plus three other jurisdictions, namely Puerto Rico, Virgin Islands (US Territory), and the District of Columbia.
-- designate WideWorldImporters as the default database
use WideWorldImporters
go

-- count of cities from clean buffers
dbcc dropcleanbuffers;
checkpoint;

set statistics io on

select count(*) number_of_cities
from Application.Cities

set statistics io off

-- count of cities from dirty buffers
--dbcc dropcleanbuffers;
--checkpoint;

set statistics io on

select count(*) number_of_cities
from Application.Cities

set statistics io off

-- count of stateprovinces from clean buffers
dbcc dropcleanbuffers;
checkpoint;

set statistics io on

select count(*) number_of_stateprovinces
from Application.StateProvinces

set statistics io off
Here’s a side-by-side comparison of the results sets from the first and second query statements. The results set from the first query appears on the left, and the results set from the second query appears on the right. Unsurprisingly, both query statements return an identical count of rows for the Cities table.
| From first query statement | From second query statement |
|---|---|

|

|
The following screen shot presents an excerpt from the Messages pane for the first and second query statements. There are some easily identifiable differences between the message lines for each query.
- The messages for the first query of Cities appears on the first Table ‘Cities’
line.
- Recall that the dbcc dropcleanbuffers and checkpoint statements clean and clear the data cache before invoking the query.
- The non-zero values for physical reads and read-ahead reads indicate that SQL Server needs to transfer data pages from disk storage to the data cache before executing the query plan for the query statement.
- The non-zero value for logical reads indicates the number of data pages accessed from the data cache while executing the query plan for the query statement.
- The messages for the second query of Cities appears on the second Table ‘Cities’
line.
- Notice the values for physical reads and read-ahead reads are both zero. This is because the source data for the query was previously transferred from disk to the data cache for the first query.
- The data cache was not cleaned and cleared prior to running the plan for the second query.
- Because the second query does not need to collect source data from disk-based storage (0 physical reads and 0 read-ahead reads), it is more efficient than the first query.

Here’s the output from the third query. It returns just one value of 53, which is the count of rows in the StateProvinces table.

Here’s an excerpt from the Messages tab in SSMS from the third query.
- Notice on the last line that this tab shows io statistics for the StateProvinces table, instead of the Cities table as in messages for the first two queries.
- The Scan count is 1 for all three queries. This is because each query scans a table just once to compute a count of the rows in a table.
- The sum of the physical reads and read-ahead reads is just 1 as opposed to 102 in the first query. Recall that there are 37,940 rows in the Cities table but just 53 rows in the StateProvinces. This means the third query requires the transfer of much less data than the first query.
- Finally, the number of logical reads is much less for the third query (2) is much less than for the first and second queries (110). Again, the third query must count fewer rows.

Impacts of filtering with having versus where clauses on io statistics
The next pair of queries contrast two different approaches to returning counts of the number of cities by state beginning with the letter A in the WideWorldImporters database. There are four states that begin with the letter A in the US; these are Alabama, Alaska, Arizona, and Arkansas. This section highlights two ways to count the number of cities by state for states beginning with the letter A.
- You can join the Cities table to the StateProvinces table and then group the states by state name with a having clause for states names starting with the letter A. Then, just count the number of rows by state name.
- Alternatively, you can use a where clause to filter the join or rows from the Cities and StateProvinces tables. Then, you can count the number of rows by state name.
Here’s a script to count the cities by state for states beginning with the letter A with both approaches. Each approach is embedded in a matching pair of set statistics io on and off statements. This design facilitates contrasting the efficiency of each approach.
- Again, the script starts with use statement to specify the default database context.
- The first block of code after the use statement is for the filtering with the having clause which appears after the group by clause.
- The second block of code after the use statement is for filtering with the where clause before the group by clause. This code block appears after the first block with the having clause.
- A line of dashes demarcates each of the three code blocks for the use statement, the query with the having clause, and the query with the where clause.
-- designate WideWorldImporters as the default database
use WideWorldImporters
go
---------------------------------------------------------------------------
-- count of Cities by StateProvince with having clause
dbcc dropcleanbuffers;
checkpoint;

set statistics io on

-- count of Cities within StateProvinces
select StateProvinces.StateProvinceName, count(*) number_of_cities
from Application.Cities
inner join Application.StateProvinces
on Cities.StateProvinceID = StateProvinces.StateProvinceID
group by StateProvinces.StateProvinceName
having left(StateProvinceName,1) = 'A'
---------------------------------------------------------------------------
set statistics io off

-- count of Cities by StateProvince with where clause
dbcc dropcleanbuffers;
checkpoint;

set statistics io on

-- count of Cities by StateProvince
select StateProvinces.StateProvinceName, count(*) number_of_cities
from Application.Cities
inner join Application.StateProvinces
on Cities.StateProvinceID = StateProvinces.StateProvinceID
where left(StateProvinceName,1) = 'A'
group by StateProvinces.StateProvinceName

set statistics io off
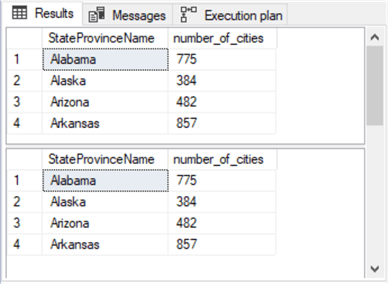
Here’s the results sets from the query with the having clause compared to the results set with the where clause. The top results set is for the query with the having clause. The bottom results set is for the query with the where clause. As you can plainly see from this comparison, it does not matter from a results perspective whether you compute count of cities by state with a having clause or with a where clause. However, do the two different approaches have identical query costs?
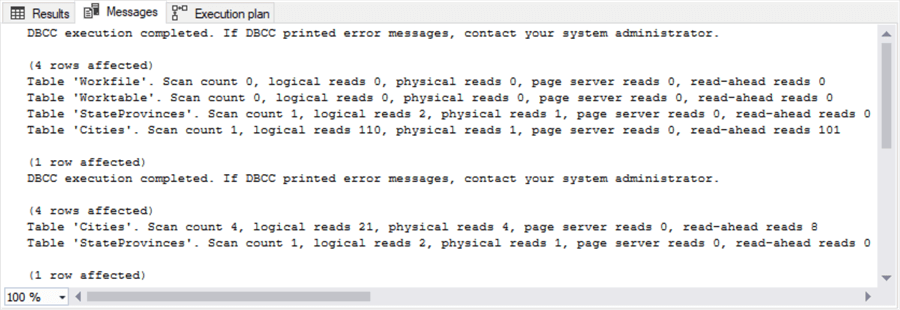
The following screen shot shows an excerpt from the Messages pane output for the two queries. This output was populated by the set statistics io on and off statement pairs.
- A set of four rows towards the top which starts with “Table ‘Workfile’” through “Table ‘Cities’ is for the query with the having clause, and the two rows towards the bottom following the second DBCC executed completion announcement is for the query with the where clause.
- The query with the having clause is more complex and involves more disk-based
reads than the query with the where clause.
- For example, there are a total 102 data pages accessed via disk reads (physical reads and read-ahead reads) in the statistics for the Cities table with the having clause. In contrast, there are just 12 data pages accessed via disk reads for the Cities table with the where clause.
- Also, the execution of the query with the having clause requires two temporary resources (Workfile and Worktable) that are not required for the processing for the query with the where clause.
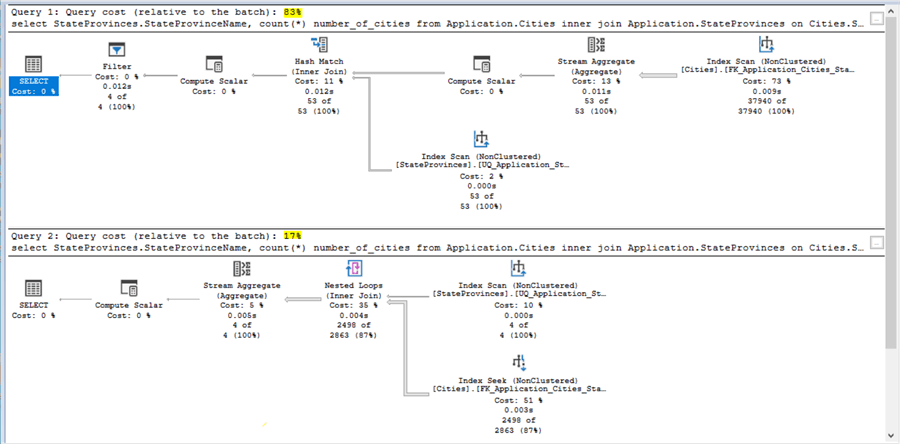
Another way of developing an appreciation for which query has the lowest impact on SQL Server is from comparing in a single batch the query cost relative to batch statistic from running a query with a having clause versus a where clause.
- The execution plan query cost statistic for the having clause appears above the execution plan with the where clause.
- The query cost for the query with the having clause is 83% versus just 17% for the query with the where clause.
- The diagrams below confirm the set statistics io statements by showing the cost for the query with the having clause is dramatically more than for the query with the where clause.
Impact of using a windows aggregate function
You might be tempted to try using a windows aggregate function to generate results like those from the preceding section because windows aggregate functions can aggregate and partition in a single statement. MSSQLTips.com offers a helpful tutorial on using windows aggregate functions. Depending on your requirements, windows aggregate functions may or may not be the optimal approach if you seek a tabulated results set. This section illustrates how the set statistics io statement along with an execution plan diagrams can shed light on the suitability of this approach compared to a more traditional approach with a where clause for getting tabulated results like those in the preceding section.
The following script shows the use of the windows aggregate count function with two queries for aggregating cities across a select set of StateProvince values (for StateProvince values whose name starts with the letter A). The source data for the tabulated results is the same as in the preceding section – namely, the StateProvince and City tables in the Application schema of the WideWorldImporters database.
The following script shows two queries for getting the tabulated results. Both queries use the windows aggregate count function. The queries are identical except for one keyword (distinct), which changes the output and has a substantial impact on the resource consumption of the queries.
-- designate WideWorldImporters as the default database
use WideWorldImporters
go

-- count of cities by StateProvince with where clause
-- and windows aggregate count function

dbcc dropcleanbuffers;
checkpoint;

set statistics io on

select
StateProvinces.StateProvinceName
,count(Cities.CityID)
over (partition by StateProvinces.StateProvinceName) number_of_cities
from [WideWorldImporters].[Application].[Cities]
inner join Application.StateProvinces
on Cities.StateProvinceID = StateProvinces.StateProvinceID
where left(StateProvinceName,1) = 'A'
order by StateProvinces.StateProvinceName

set statistics io off

-- count of cities by StateProvince with where clause
-- and windows aggregate count function
-- remove duplicate rows with distinct keyword

dbcc dropcleanbuffers;
checkpoint;

set statistics io on

select distinct
StateProvinces.StateProvinceName
,count(Cities.CityID)
over (partition by StateProvinces.StateProvinceName) number_of_cities
from [WideWorldImporters].[Application].[Cities]
inner join Application.StateProvinces
on Cities.StateProvinceID = StateProvinces.StateProvinceID
where left(StateProvinceName,1) = 'A'
order by StateProvinces.StateProvinceName

set statistics io off
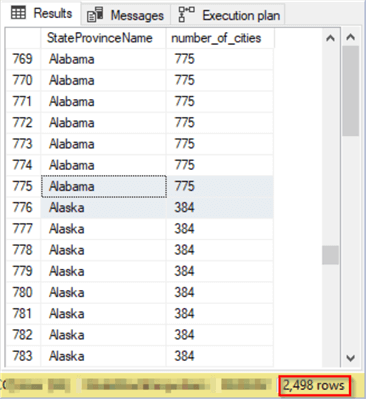
The following screen shot is an excerpt of the results set for the first query without the distinct keyword. There are 2498 rows in the result set.
- Each row is populated with the name of a StateProvice value and the count of the cities in the corresponding StateProvince. For example, the last row for the Alabama StateProvince is 775 because there are 775 cities in Alabama (the database uses the term city loosely; for example, some locales counted as cities are just towns).
- You know from the output from the prior section that the counts are for four StateProvince values; the counts are: 775, 384, 482, and 857. These four counts total to 2498, which is the number of rows in the results set for the query without a distinct keyword.
While you may occasionally seek a results set like the one in the preceding screen shot (I have coded this kind of result set numerous times without the benefit of a windows aggregate function), it is not a simple tabulation of the counts across the four StateProvice values. However, you can get to a simple tabulation of the counts across distinct StateProvince values by running the query for the preceding results set with a distinct keyword preceding the items in the select list. In fact, this is the second query in the preceding script.
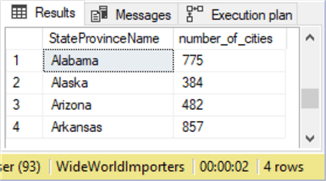
The results set for the second query appears below. Notice there are just four rows in this results set. This results set exactly matches the return values from the queries in the preceding section. Therefore, by specifying a distinct keyword for results from a query based on a windows aggregate function you can duplicate the results from a more traditional query based on filtering with either where or having clauses and a group by operator.
For the purposes of this tip, we have two questions:
- Does the addition of the keyword materially add to the resources for performing the query?
- Does the use of windows aggregate function generate tabulated aggregate results with less resource consumption than queries based on where clause filtering and group by operators?
By examining the Messages tab in SSMS, you gain some insight into the answer for the first question. Unsurprisingly, the use of the distinct keyword results in a higher query cost even though it does return the tabulated counts. Here’s an excerpt from the Messages tab.
- The set statistics io messages for the first query without the distinct keyword appears after the first DBCC execution completed message, and the set statistics io messages for the query with the distinct keyword appear after the second DBCC execution completed message.
- The messages are identical with the exception of a row for a table named “Workfile”. The row does not reveal any statistics about how the extra object named Workfile is used, but the distinct keyword does introduce the Workfile object into the io activity for the second query.
- I also examined the execution plan diagrams for the two queries. The query cost for a batch with both queries shows that the second query with the distinct keyword requires more resources. The costs are 39% for the query without the distinct keyword and 61% for the query with the distinct keyword. You can generate the batch with the execution plan diagrams for yourself by selecting the two queries in SSMS, clicking the Include Actual Execution Plan tool on the SQL Editor tool bar, and running the query.
- Although the addition of the distinct keyword does add relative costs, it also generates the desired result, which is likely to be a more commonly needed result as well.

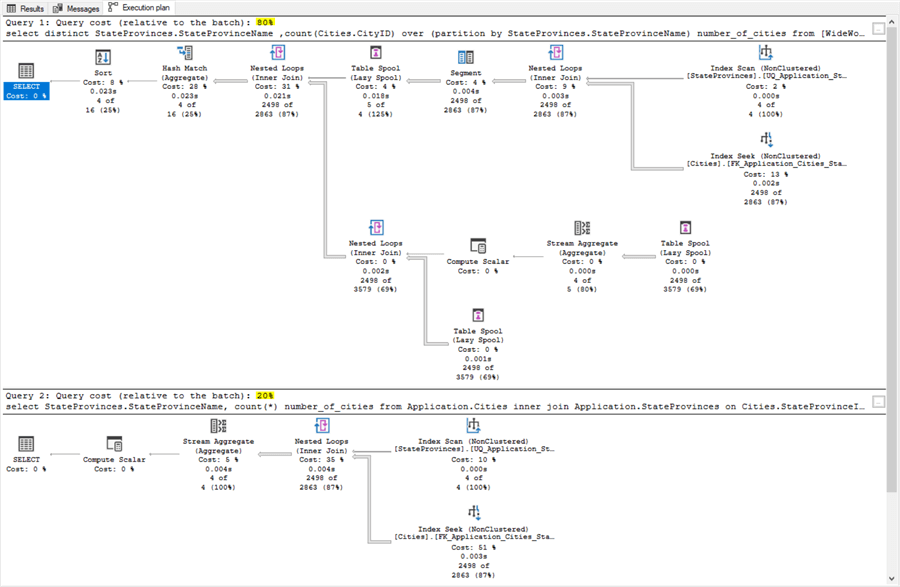
The second question about whether the windows aggregate function with the distinct keyword is more conservative in its use of resources than a more traditional SQL approach with a where filter and basic SQL aggregate function can most easily be answered by comparing the execution plan diagrams. When the two queries are run together in a single batch, the following results appear in the Execution plan tab.
- The top execution plan is for the query with the distinct keyword and the windows aggregate function. The bottom execution plan is for the query with the where clause and the basic count aggregate function.
- As you can see, the approach using a windows aggregate function with the distinct keyword consumes 80% of the resources in the batch while the query with the basic aggregate function and where clause requires just 20% of the resources in the batch.
Next Steps
The T-SQL scripts from this tip are in this tip’s download file. All the queries utilize tables from the WideWorldImporters database (instructions for downloading the database is available from a link in the “Impacts of table size and reading from buffer on io statistics” section). The download file with the queries from this tip include:
- a framework for using the set statistics io statement to return io statistics associated with a T-SQL query
- T-SQL code for three different sets of comparisons between queries
Try out the code examples for this tip with data from the WideWorldImporters database. Of course, the best way to test the results is with your own queries for data available within your organization. This approach will allow you to choose query designs that put the lightest load on your SQL Server database servers. By systematically applying the optimal design guidelines, you may be able to forestall major software/hardware upgrades while also achieving greater throughput across your organization’s SQL Servers.
About the author
 Rick Dobson is an author and an individual trader. He is also a SQL Server professional with decades of T-SQL experience that includes authoring books, running a national seminar practice, working for businesses on finance and healthcare development projects, and serving as a regular contributor to MSSQLTips.com. He has been growing his Python skills for more than the past half decade -- especially for data visualization and ETL tasks with JSON and CSV files. His most recent professional passions include financial time series data and analyses, AI models, and statistics. He believes the proper application of these skills can help traders and investors to make more profitable decisions.
This author pledges the content of this article is based on professional experience and not AI generated.
View all my tips


