Problem
Query tuning is a skill that all SQL Server database users, administrators and developers that write queries should have some knowledge of to make sure queries they are writing are efficient and perform in an optimal manner. There are several things that could be done to check query performance to help with tuning and in this article we will cover some of the things you should know.
Solution
This tutorial will discuss general guidelines to check and fix problematic SQL queries, please note that this is not an extensive list, but more of a guide on how to start and some of the most common issues. These are the “general” things to check first when troubleshooting a query, and once you have identified the general issue, you can dig deeper and find the cause, and then solve it.
These tips can be applied for SQL Server running on-premises or in the cloud.
Always Check the Execution Plan
No matter if you use SQL Server Management Studio, Azure Data Studio, or a third party tool you should always look at the query plan to find issues and what to focus on to make improvements.
You can learn more about how to create an execution plan with these articles:
- SQL Server Execution Plan Overview
- How to read SQL Server graphical query execution plans
- Comparison between a SQL Server Graphical Plan and Text Plan
Once you have an execution plan (I prefer the visual form), we can check several things as shown below.
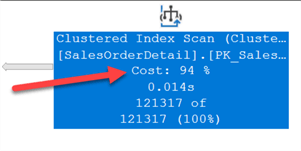
Find the Operators that have Highest Cost
In this example, we can look at the cost for the Index Scan operation and it shows it is taking 94 percent of the total query cost. Based on the cost this gives us an idea of where to start looking to improve performance.
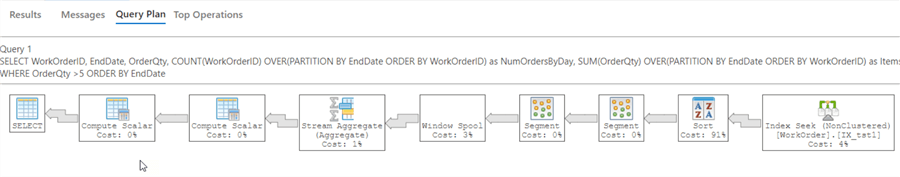
For larger queries it can be more challenging since there can be many operators, like the plan below. But we can see the Sort operation is 91%.
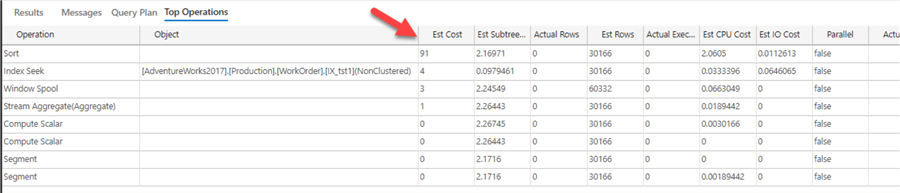
If you are using Azure Data Studio, there is a Operations grid that allows us to find this easier.
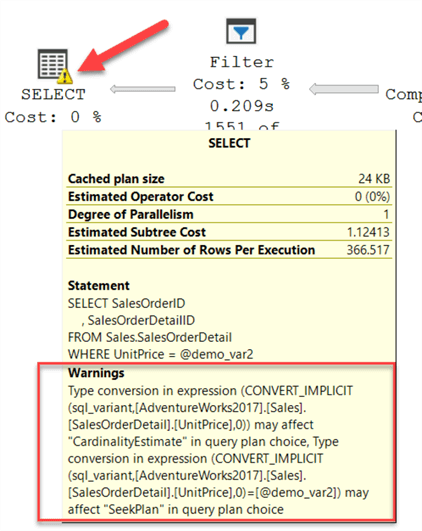
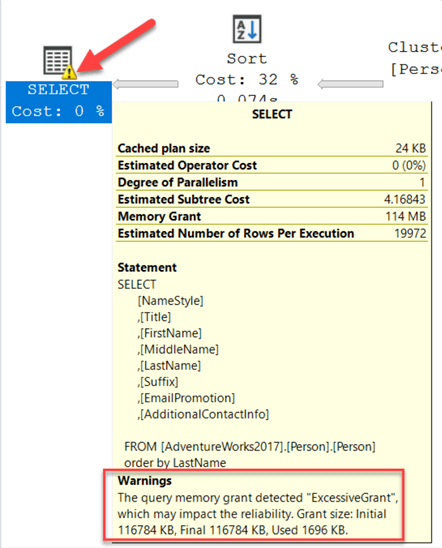
Look for Warnings
For some operations, warnings are generated and you can identify these by a yellow symbol as shown below. If you hover over the operation you can see the details of the warning.
In the below example the warning is an “implicit conversion” warning.
Here is another example that shows a “high memory grant” warning.
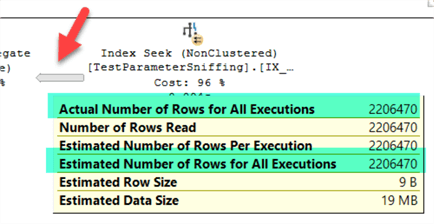
Arrows Between Operators Provide Good Insight
The arrows provide information about estimated and actual rows, and data size between operations. The fatter the arrow, means more data and rows are passed between operators.
For the same query the size of the arrow could be different depending on the parameter value that was used.
This shows a bigger arrow and if we hover of the arrow we can see the details and a high number of rows.
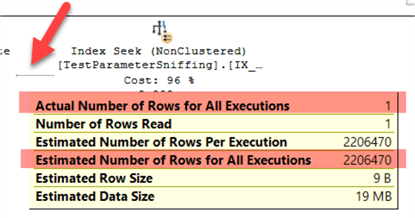
If we run the query again with a different parameter value we can see the arrow is smaller and shows only 1 row.
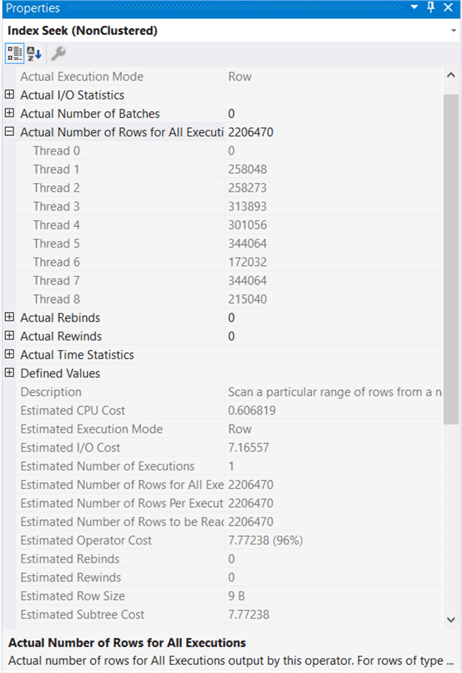
Execution Plan Properties Window
You can check any operator or the entire plan with in-depth information by right clicking on it and selecting Properties.
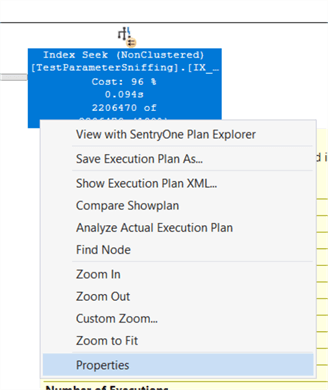
The properties window will show much more information as shown below.
Index Suggestions
In some cases, the execution plan suggests indexes that can be created to improve the plan. These are shown in green text as shown below.

If you right click you and select “Missing Index Details” to get information and a script to create the new index. I suggest reviewing the suggestions first and reviewing existing indexes before creating to avoid duplicate indexes.

SARGABLE Queries
Most production queries have some type of filter to reduce the number of rows that are returned and this is why having proper indexes is so important, but not everything is just about having an index, you also need to make sure the query is using the index.
To make efficient use of indexes, the query must be SARGable which stands for: search + argument + able, for query processing. It indicates when a search argument (like in the WHERE clause) can effectively use an index. This heavily involves query design and to fix this kind of issue, most times code changes are required.
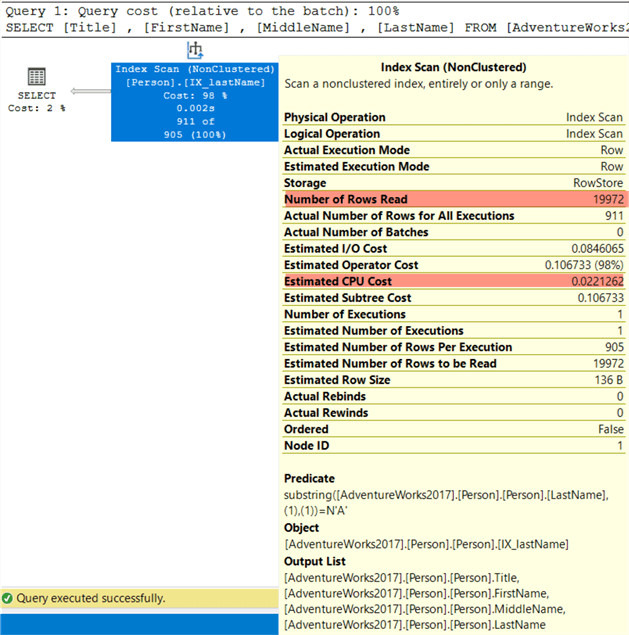
For example, for this simple query we want to obtain the information where last name starts with an A.
SELECT [Title]
    , [FirstName]
    , [MiddleName]
    , [LastName]
FROM [AdventureWorks2017].[Person].[Person]
WHERE SUBSTRING(LastName,1,1) = 'A'
Even when the right index is used, an index scan is performed as shown below, because the argument in the WHERE clause is not sargable. The engine cannot guarantee that the substring function will return the correct value, also it cannot “guess” what it will be return, so a scan is used.
If we modify the query to remove the function and put the manipulation on the parameter side as so:
SELECT [Title]
, [FirstName]
, [MiddleName]
, [LastName]
FROM [AdventureWorks2017].[Person].[Person]
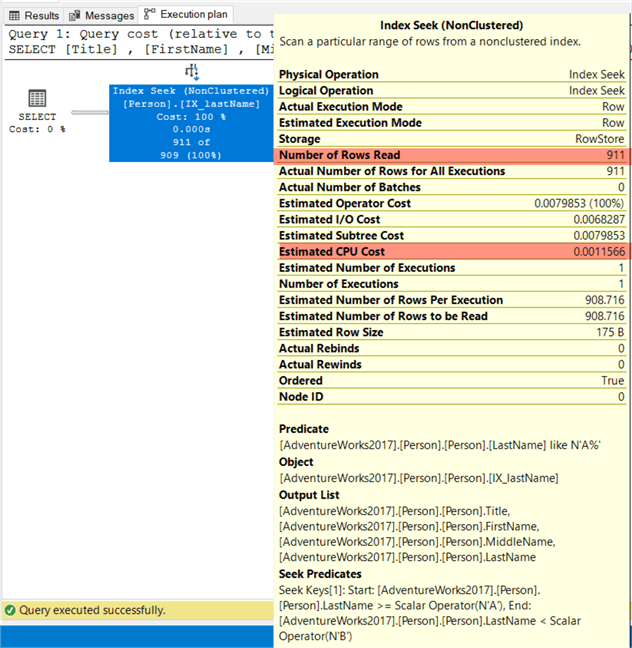
WHERE LastName LIKE 'A%'
Then the engine can directly retrieve the required values using an index seek, since it does not have to guess which values the column has:
Data Distribution
If for some reason a query runs fast sometimes and much slower other times it could be related to data distribution and the statistics.
You can check the tables that are part of the query and if you detect any query step that is returning a large dataset, you can check the statistics distribution to get an estimate of how your data is distributed. You can access this data by expanding the table in SSMS and under Statistics select one of the items, right click and select Properties. Then look at the Details page.
Below we can see the data is pretty well distributed without any one segment containing the majority of the rows.

You can obtain the same information by running the following command, by including the table name and the statistics name for the two parameters:
DBCC SHOW_STATISTICS ("Production.WorkOrder", _WA_Sys_00000007_59904A2C);
GO
A good database design should include data purging and removal of historical data to some type of archival system. Keeping the data sets smaller will assist with joins and filtering as well as maintenance tasks.
Performance Metrics
Along with some of the things we discussed above there are plenty of other tools that can assist with determining why queries are running slow. It may not be a problem with your query at all, but maybe something else that is running.
There are several free tools that you can use to capture current statistics and data such as sp_whoisactive, the SQL Server First Responder Kit or this wait stats query. With these you can find long running queries, high CPU utilization, wait stats and much more.
Other things you could use include SQL Performance Counters, Extended Events and Query Store. If you need to look back in time you could setup processes to collect data on a periodic bases so you have some historical data.
I wouldn’t spend a lot of time on building your own tools, because there are plenty of third party performance tools you could use to assist with tuning.
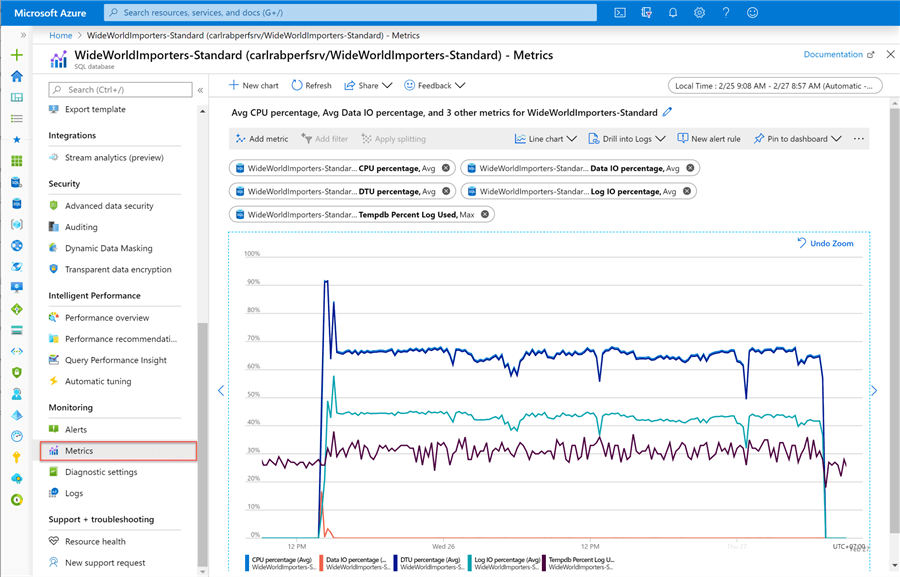
If you are using Azure SQL Database there are built-in performance metrics you can use from the Azure portal as shown below.
New SQL Server Features
With each new version of SQL Server, new features are added to make queries run more efficiently. Below are some of the enhancements that were introduced in SQL Server 2017 and SQL Server 2019.
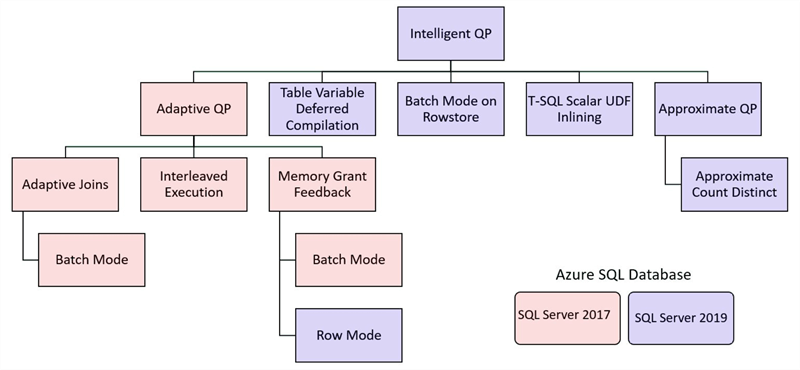
Microsoft implemented some AI and machine learning features, so based on the workload the server can adapt to your needs and make improvements without any effort from you. We cannot cover each feature, but you can read more about intelligent query processing in SQL databases.
Since SQL Server 2017, automatic tuning is available and this feature can identify query performance issues and make configuration changes automatically, such as:
- Automatic plan correction – it forces the last known good plan when a plan regression occurs (a common cause is parameter sniffing).
- Automatic index management – (only for Azure SQL) if enabled it automatically adds or removes indexes based on usage
Next Steps
- You can read other query tuning tips
- You can learn more about intelligent query processing memory grant feedback
- You can download Azure Data Studio

Eduardo Pivaral is an MCSA, SQL Server Database Administrator and Developer with over 15 years of experience working in large environments.
- MSSQLTips Awards: Trendsetter (25+ tips) – 2020 | Author of the Year Contender – 2019 | Rookie of the Year – 2018
