Problem
I know SQL Server can run queries in parallel, but how can I tell that a query uses a parallel execution plan and how can I get information about the number of CPUs used when a query executes in parallel? Check out this tip to learn how.
Solution
The parallelism concept comes from dividing a big task into smaller tasks, where each small task is assigned to a specific person, or processor in the case of a SQL Server query, to accomplish part of the main task. Finally, the partial results taken from each small task will be combined together into one final result. You can imagine how much faster this can be done and the performance gain that you can get from running multiple serial tasks at the same time in parallel, compared to running one big task serially!
Before going through the tip, it is beneficial to understand a number of technical terms related to the parallelism concept in SQL Server:
- The Scheduler is the physical or logical processor that is responsible for scheduling the execution of the SQL Server threads.
- The Worker is the thread that is bound to a scheduler to perform a specific task.
- The Degree of Parallelism is the number of workers, or the number of processors, that are assigned for the parallel plan to accomplish the worker task.
- The Maximum Degree of Parallelism (MAXDOP) is a server, database or query level option that is used to limit the number of processors that the parallel plan can use. The default value of MAXDOP is 0, in which the SQL Server Engine can use all available processors, up to 64, in the query parallel execution. Setting the MAXDOP option to 1 will prevent using more than one processor in executing the query, which means that the SQL Server Engine will use a serial plan to execute the query. The MAXDOP option can take value up to 32767, where the SQL Server Engine will use all available server processors in the parallel plan execution if the MAXDOP value exceeds the number of processors available in the server. If the SQL Server is installed on a single processor server, the value of MAXDOP will be ignored.
- The Task is a small piece of work that is assigned to a specific worker.
- The Execution Context is the boundary in which each single task run inside.
- The Parallel Page Supplier is a part of the SQL Server Storage Engine that distributes the data sets requested by the query within the participated workers.
- The Exchange is the component that will connect the different execution contexts involved in the query parallel plan together, to get the final result.
The decision of using a parallel plan to execute the query or not depends on multiple factors. For example, SQL Server should be installed on a multi-processor server, the requested number of threads should be available to be satisfied, the Maximum Degree of Parallelism option is not set to 1 and the cost of the query exceeds the previously configured Cost Threshold for Parallelism value.
The aim of this tip, is to retrieve the information of the parallel query threads from the actual execution plan of the query. To force the SQL Server Engine to execute the submitted query using a parallel plan, we will set the Cost Threshold for Parallelism value to 0, to make sure that in all cases the query cost will exceed the Cost Threshold for Parallelism value and we will keep the Maximum Degree of Parallelism option with its default 0 value, to allow the SQL Server Engine to use all available processors while executing our query, that are 4 processors in my machine used for this demo.
The Cost Threshold for Parallelism value can be set using SQL Server Management Studio, by connecting to the SQL Server instance, right-clicking on the instance name and choosing the Properties option. From the Advanced page of the Server Properties window, scroll down to the Parallelism section, from where you can override the default value of the Cost Threshold for Parallelism option, which is 5, or the Max Degree of Parallelism if required, as shown in the screenshot below:

You can also override the default value of the Cost Threshold for Parallelism using sp_configure. To be able to change the Cost Threshold for Parallelism value, you should use sp_configure to enable the Show Advanced Option first, as shown in the script below:
EXEC sp_configure 'show advanced options', 1;
RECONFIGURE;
GO
EXEC sp_configure 'cost threshold for parallelism', 0;
RECONFIGURE;
GO
EXEC sp_configure 'show advanced options', 0;
RECONFIGURE;
Demo of Parallel Execution Plan
The server is now configured for the demo. Let’s create a new table using the CREATE TABLE T-SQL statement as shown below:
USE MSSQLTipsDemo
GO
CREATE TABLE ParallelDemo
( ID INT IDENTITY (1,1) PRIMARY KEY,
  FirstName NVARCHAR (200),
  LastName NVARCHAR (200),
  PhoneNumber VARCHAR(50),
  BirthDate DATETIME,
  Address NVARCHAR(MAX)
 )
Once the table is created, we will fill the table with 100K records using the INSERT INTO statements below:
INSERT INTO ParallelDemo VALUES ('John','Horold','+96255889955','1987-01-08','Jordan - Amman - Mecca Street - Building 77')
GO 50000
INSERT INTO ParallelDemo VALUES ('Michel','Anglo','+96255776655','1985-06-02','Jordan - Amman - Mecca Street - Building 74')
GO 50000
Now we want to enable the "Include Actual Execution Plan" and then run the below SELECT query:
SELECT [ID]
      ,[FirstName]
      ,[LastName]
      ,[PhoneNumber]
      ,[BirthDate]
      ,[Address]
  FROM [MSSQLTipsDemo].[dbo].[ParallelDemo]
  WHERE Address LIKE '%AMM%'
  ORDER BY BirthDate desc
After this completes running, we can check the execution plan generated from executing the query, you will see that the SQL Server Engine decides to use a parallel plan to execute the query, due to the fact that the cost of that query exceeds the Cost Threshold for Parallelism value.
We can see below that the execution plan is a parallel plan, because of the Parallelism operator and also the yellow circles with two arrows under each operator that executed with parallelism.

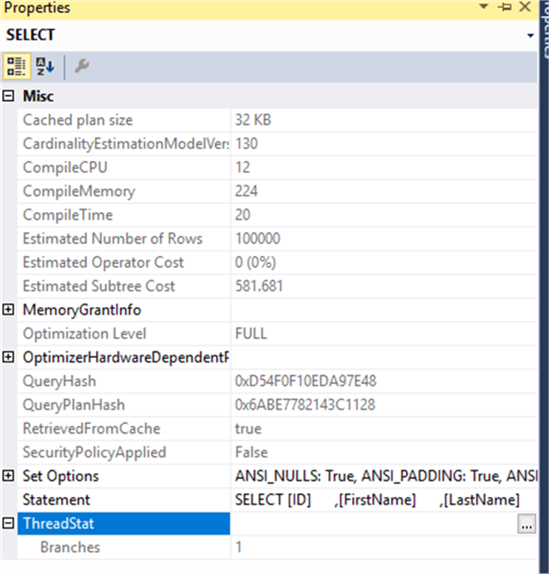
The execution plan is not just a graph, it contains valuable information that describes the execution process of the submitted query. To view this information, right-click on the SELECT node in the execution plan and choose the Properties option. From the Properties window, you can see the number of processors that are used to process the submitted query from the Degree of Parallelism attribute, under the Misc section as shown below:

From this same window, information about the parallel query threads are also displayed under the ThreadStat section. In that section, you can check the parallel query Branches attribute, that shows the number of concurrent execution paths within the query execution plan, the NUMA Node ID, the number of parallel threads reserved for the specified NUMA node under the ReservedThreads attribute and the number of threads used while executing the query, under the UsedThreads attribute.
From the Properties window, you can derive that the SQL Server Engine used 4 processors to execute the query. In addition, the query execution plan has one execution path, in which 4 threads are reserved and used to execute the submitted query using a parallel plan.
The same information can also be derived from the XML execution plan, by looking under the ThreadStat section, as shown below:

You can also dive deeper to check the I/O and the CPU resources consumed by each thread. Right-click on the Clustered Index Scan node in the execution plan and choose Properties. From the displayed Properties window, you can expand the Actual I/O statistics node to check the number of logical and physical reads operations performed by each thread while executing the query. In addition, you can also check the number of rows that are retrieved from each thread, the CPU time consumed by each thread and finally the execution time that is elapsed by each thread to accomplish its task, as shown below:
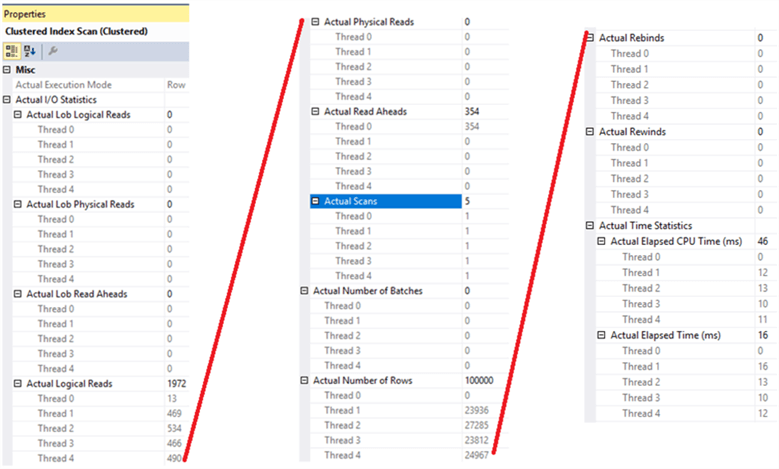
The results match up with the SELECT node Properties window, where there are 4 worker threads that participated in the query tasks execution and one coordinator thread that coordinates between the worker threads.
Take into consideration that the previous information can only be retrieved from the Actual Execution Plan that is generated after executing the query. If you try to search for that information from the Estimated Execution Plan, without executing the query, no information will be displayed as the query needs to execute in order to specify the number of processors that will be assigned to the query from the available processors during the query execution as shown below for the Estimated Execution Plan.
Getting More SQL Server Parallelism Information
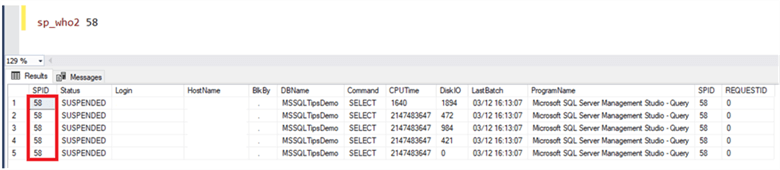
While the query is running, you can simply run the sp_who2 command with the query session ID to get information about the threads that are used to execute the submitted query during the query execution, as shown below:
In the execution plan, each operator in that plan had a number assigned to it and a scheduler that is used to execute it. This information can be retrieved by querying the sys.dm_os_tasks system catalog view and joining it with sys.dm_os_workers and sys.dm_exec_query_profiles system catalog views, as in the T-SQL script below:
SELECT OSTSK.scheduler_id,
       qp.node_id,
       qp.physical_operator_name
FROM sys.dm_os_tasks OSTSK
LEFT JOIN sys.dm_os_workers OSWRK  on OSTSK.worker_address=OSWRK.worker_address
LEFT JOIN sys.dm_exec_query_profiles qp on OSWRK.task_address=qp.task_address
WHERE OSTSK.session_id=58
ORDER BY scheduler_id, node_id;
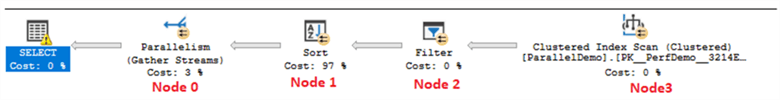
Executing the previous script while running the SELECT statement with the Actual Execution Plan enabled, the result will show us that the three plan operators: Sort, Filter and Clustered Index Scan with the ID of each operator shown beside it. This is executed four times, using the four schedulers. The Parallelism operator with ID equal to 0 will be executed once by the fourth scheduler to connect all execution contexts together in the last step, as shown below:

Below I have added the Node values that correspond with the above query results with the execution plan to help further illustrate.
Next Steps
- Check out the following resources:

Ahmad has a Bachelor’s Degree in Computer Engineering from the University of Jordan and five years of experience working as a SQL DBA, gaining valuable knowledge of database structures, practices, principles and theories. His experience also includes.NET development, working with database applications, scripting and creating SQL queries and views. His personal abilities include having very strong communication and interpersonal skills, the ability to prioritize and to make good sound decisions that benefit the company. He has experience in upgrading, configuring, securing, tuning and monitoring SQL Servers since SQL Server 2005. This includes SQL Server performance tuning, SQL Server resource governor management, SQL Server maintenance plans, SQL Server data collection (Reports) analyzing and SQL databases design, developing, indexing and query optimization. In addition, he is familiar with installing and configuring SSRS, SSIS and SSAS. When it comes to disaster recovery and high availability, he has a solid foundation in SQL backup and recovery scenarios, mirroring, replication, log shipping, SQL clustering and AlwaysOn technology.
- MSSQLTips Awards: Author Contender – 2016-2017 | Trendsetter (25+ tips) – 2016 | Rookie Contender – 2015
