Problem
When a SQL Server query executes, there are specific steps that are taken before the query is executed. In addition, there are tools that you can use to help troubleshoot and tune a query. In this tip we will take a look at these concepts to help you tune your queries to run faster.
Solution
This tip will help you understand the SQL Server query execution steps and will help you optimize a query by suggesting tuning recommendations.
The SQL Server Execution Plans are an important tool to help understand the in-depth details about query execution. In SQL Server, when a query is submitted and executed by the database engine, it performs several steps as shown below. The execution plan is one of the measures which provides step by step instructions about the query execution flow and this can be used to figure out where there are issues.
A SQL Server Execution Plan determines how efficient a SQL query will be. Execution plans provide us the behavior of an executed query and indicates whether indexes are used or not when the query runs. An execution plan provides information about indexes, joins, loops, and more. It can also provide recommended instructions for improving query performance. Depending on the parameter conditions, we can decide whether the execution plan is good or bad, which we will talk about more.
The relational engine performs a few steps from query submission to query output. The database engine has various implementation phases including parsing, binding, optimizing and execution which are discussed below.
SQL Server Query Parsing
A SQL Server query contains a standard format of syntax which can be understood by the database engine. So, the query parsing step checks whether the T-SQL syntax is written correctly or not. The query parsing step will throw an error if part of the T-SQL query has spelling mistakes, missing commas, etc. Once we get an error, the query parser will suggest which part of the query needs to be corrected.
If you have a very large T-SQL query and you get an error, it might not be obvious which part needs to be corrected. In this case, in SQL Server Management Studio (SSMS) you can double click on the error message and it will highlight the part of the T-SQL that has an issue. For example, if we write SELCT instead of SELECT, the parser will stop its process and throw this error. You can then double click on the error message and it will show you where the error is in the code.
Msg 102, Level 15, State 1, Line 4 Incorrect syntax near
SQL Server Query Binding
Once the parsing process has completed successfully, it will proceed to the binding process. The algebrizer performs the binding operations which checks all relevant tables, columns, data types and other database objects associated with the query.
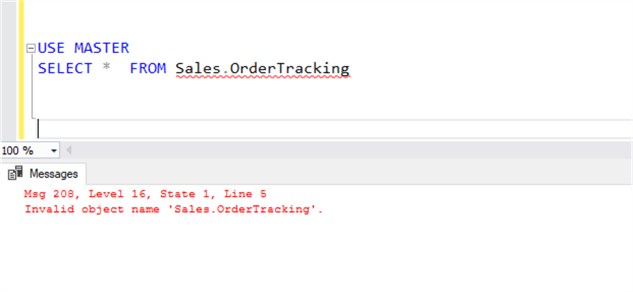
When a query is submitted and executed, it will perform a validation process to determine if the database objects which are used in the query are present in the database. If objects are not present or the user login that is executing the query does not have permission to the objects, it will throw an error.
For the following example, I am intentionally executing a SELECT query in the master database for an object that does not exist and it throws an error that the object is not present in the database.
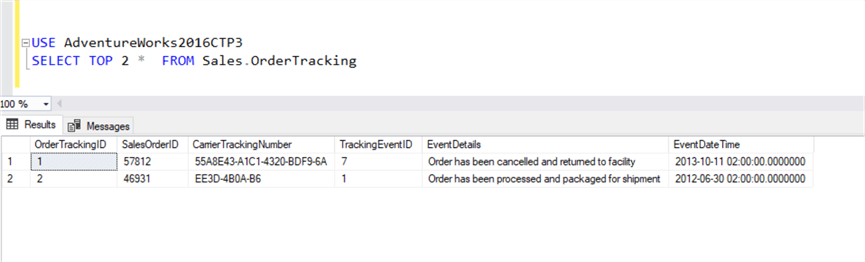
For the following example, the query completed successfully and provides results because the object is present in the AdventureWorks database. So, these validation steps are performed in the binding phase.
SQL Server Query Optimization
The query optimization process optimizes data manipulation statements (DML) which require optimization to improve query performance. Query optimization uses certain operators which are used to read indexes and other objects. The query optimizer process generates a SQL Server execution plan of the requested query or batch of statements or stored procedure and stores it in the plan cache, so the same execution plan can be used in the future if the same query is used. When it uses a previous execution plan, the optimizer process does not perform the complete optimization process which saves time and improves performance.
SQL Server Query Execution
The query execution process executes the query as per the steps in the SQL Server execution plan generated in the optimization process. The query execution process also validates whether the execution plan is valid or not. If statistics changed on tables which were part of the execution plan, then the execution process will not consider that execution plan and the optimizer will generate a new execution plan.
For the best execution plan, it is recommended to have updated statistics and allow the database engine to use the previously generated execution plan for the same query or same set of statements. Sometimes, we can observe that the execution plan for some query generates in a short time and for other queries it takes much longer. Once an execution plan is created, it is stored in the plan cache which is part of memory and by reusing an existing plan it can reduce the execution time and improve performance.
Each SQL Server execution plan has an age factor, the older an execution plan is it may not still be valid due to changes in the data. So, if we want to clear the plan cache, we can use DBCC FREEPROCCACHE to clear the stored plans. We can also clear the cache for a specific query or stored procedures, by using the plan handle. We can get the plan handle or SQL handle from the dynamic management views (DMV) SYS.DM_EXEC_QUERY_STATS and then use DBCC FREEPROCCACHE (<Plan_handle>).
If we want to remove the cache for a database, then we can use DBCC FLUSHPRCINDB(DB_ID), where DB_ID is the database id.
How to check the Execution Plan
A SQL DBA usually has all permissions by being part of the SYSADMIN fixed server role, so a DBA usually can view the SQL Server execution plan. Logins which have permissions like SYSADMIN, db_owner, and dbcreator can see the execution plan. Sometimes, we give limited permissions to team members, so for a login which is not part of one of the items mentioned, you can grant the SHOWPLAN permission to see execution plans.
How to get a SQL Server Execution Plan
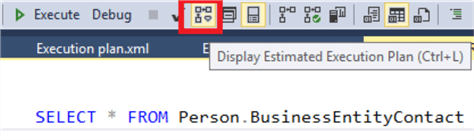
To get a SQL Server execution plan for a query or stored procedure, we need to put the query or stored procedure in a query window in SSMS and click on the icon Display Estimated Execution Plan or Include Actual Execution Plan as shown below.
Estimated Execution Plan
Actual Execution Plan
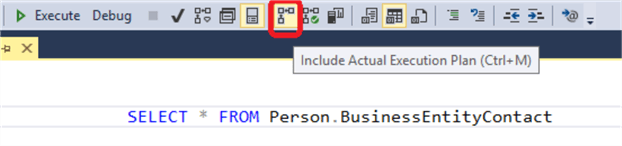
We can get an execution plan by running a query and without running a query. The execution plan created without running a query is called an estimated plan and an execution plan created after running a query is called an actual execution plan.
The SQL Server execution plan is information which the database engine provides as output and we can get this information in three different formats. Out of these formats, the graphical format is widely used and easy to read plan information.
- XML Format
- Text Format
- Graphical Format
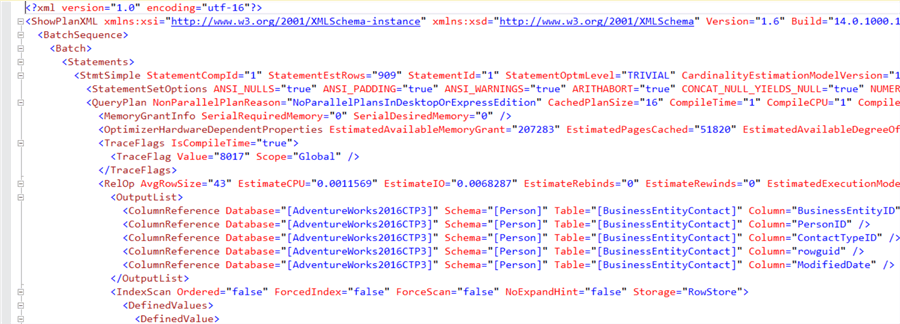
SQL Server XML Plan
A SQL Server execution plan in XML format gives us information in an XML format. The XML plan format is useful when we need to send plan details to someone or if we want to save the plan and review later. An XML plan is harder to read, so it's rarely used in real time.
I have used the AdventureWorks database to demonstrate an XML plan.

We got an estimated execution plan for the given SELECT query, and we got the graphical representation of the plan in the execution plan tab. When we hover the mouse over the plan, we get information about Physical/Logical information, I/O Cost, Number of Rows Read, etc.
We can also right click on the plan and get the menu item to save or show the XML plan. If we select Show, we can see what the XML plan looks like below.
There are also two commands which are useful to get the plan in XML format
- SET SHOWPLAN_XML ON which is used to get the plan without running a query
- SET STATISTICS XML ON which is used to get a plan at runtime.
SQL Server Text Plan
A text plan is also challenging to read, but once generated, we can transfer it in the form of a Word document.

SQL Server Graphical Plan
SQL Server Graphical Query Plans are widely used and easy to read.
Once the SQL Server execution plan is generated, it is essential to know how read and understand it.
There are three types of operators like DML operators (aka physical operator), cursor operators, and declaration operators.
DML operators can be categorized as below:
- Reading Physical Operator – Table Scan, Index Seek, and Lookup
- Joining Data – Nested Loops, Merge Join and Hash Match
Here are a couple basic operators you will see in plans.
- Table Scan – If the query does not use any indexes and it scans the entire table, it is called a table scan.
- Index Seek – If the table has indexes and the query uses the index it will do an index seek which is the fastest way to find the data.
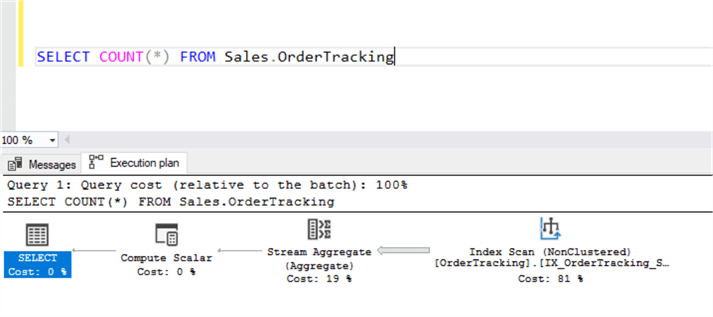
Once we get the execution plan, we can understand the execution of the query by reading the plan from right to left. We can also see the percentage for each operation that shows how much this one operation cost versus the overall query. If you add all of the percentages, they will add up to 100%.
- The first operation is an Index Scan on a non-clustered index. Since we are doing a COUNT(*) the query needs to scan through the entire table. It could also scan the clustered index if it exists, but a non-clustered index is usually smaller in size so it is faster to use this index for the operation.
- This data is then passed from the Index Scan to the Stream Aggregate. There is an arrow that shows the data flow direction. Also, if you look at the size of the arrow you can tell that the bigger arrows are passing more data from one operation to the next, versus the smaller arrows that are passing less rows of data.
- The Stream Aggregate is a grouping operator that receives multiple rows and performs grouping of the input and provides output in a single row.
- Next, this single row is passed to the Compute Scaler operation, where the count is performed.
- Then, all the way on the left, the SELECT operator is selecting and returning the value.
- You can also hover over any of these operators to get more detailed information.
Next Steps
- While working in your environment, when you execute a query, try to check the execution plan to understand the flow of a query and get indexing and other optimization suggestions.
- Check out these additional resources:

Rakesh Patil has six years of experience as a SQL Server Database Administrator with the top MNCs. Rakesh’s focus is performance tuning, configuration, Disaster Recovery, Log Shipping, Database Mirroring, Replication, AlwaysON and AWS.
Excellent information related to MS SQL. Thank you