By: Ben Snaidero | Comments | Related: > Profiler and Trace
Problem
I am investigating a SQL Server performance issue and would like to see what was running in my database when my server resources spiked. What would be the best utility to use in order to perform this analysis?
Solution
Lucky for us SQL Profiler gives us exactly the functionality we require. It allows you to load a Windows Performance Monitor Trace File in the same window as your SQL Trace file. I'll demonstrate how this can be done using a simple trace collected after running some queries against the AdventureWorks sample database. If you would like to follow along in your own environment the following example was done using SQL Server 2016 and the sample database used can be downloaded from here.
Setup
The first thing we'll do it setup a data collector set in Performance Monitor. I won't go through this setup here as that could be an entire tip on its own, but I used the following counters for my example with a sample interval of 1 second. I chose the 1 second interval since the SQL Profiler Trace is collected at such a high resolution (milliseconds) that helps identify even small spikes in resource usage.
- \Processor\% Processor Time
- \Physical Disk (0 C:)\Disk Reads/Sec
- \Physical Disk (0 C:)\Disk Writes/Sec
- \Memory\% Committed Bytes In Use
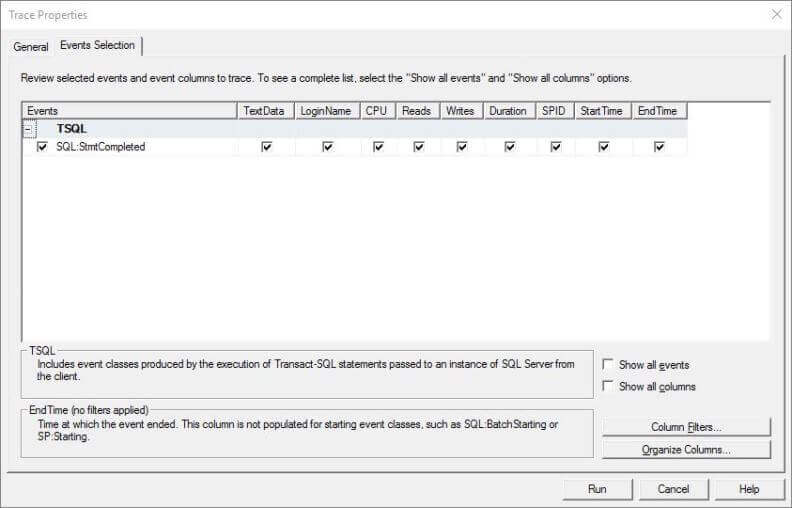
Next we can setup a SQL Trace session as shown in the following screenshot. Depending on your environment you may need to add more events (i.e. RPC: Completed) in order to capture everything in your system, but for this example since we're just running a script in SQL Server Management Studio (SSMS) we only need this one.
Once you have the data collector set running you can run the following T-SQL script which should give you some data in your SQL Trace session that you can then save into a file.
declare @x integer
set @x=1
while (@x < 10)
begin
   select * from [Person].[Person]
   select * from [Production].[Product]
   select * from [Sales].[SalesOrderHeader] H inner join [Sales].[SalesOrderDetail] D
    on H.SalesOrderID=D.SalesOrderID
   alter index [PK_SalesOrderDetail_SalesOrderID_SalesOrderDetailID] on [Sales].[SalesOrderDetail] REBUILD
   alter index [PK_Person_BusinessEntityID] on [Person].[Person] REBUILD
   waitfor delay '00:00:05'
   set @x=@x+1
end
Loading the SQL Profiler and Performance Monitor Data
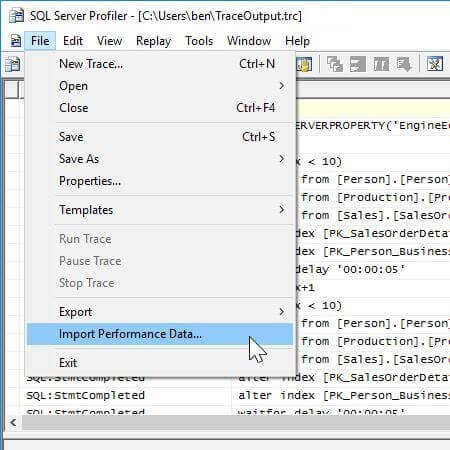
Once you have a SQL trace file and some performance monitor data files we can load the two together into SQL Profiler. You do this by first opening your trace file. Once it has completed loading you can start the process of importing your performance monitor data by selecting the "Import Performance Data..." menu item from the "File" menu as shown in the following screenshot.
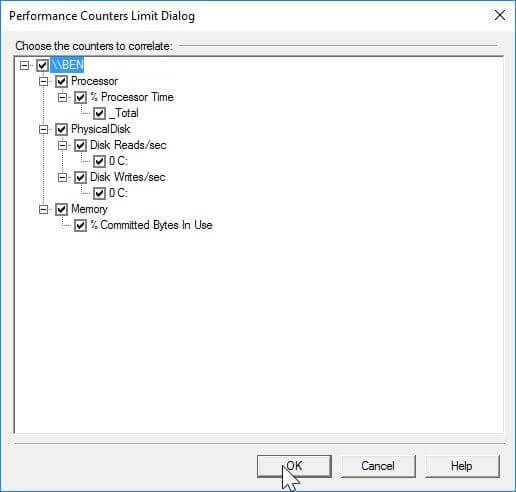
After clicking the menu item you are presented with a dialog box where you can select your performance monitor trace file. Once selected you are presented with another dialog box as shown below. In this window you can select which performance counters you want to load into SQL Profiler.
Once you are done selecting the counters you want you include and have clicked the OK button you'll see two new windows in your SQL Profiler session as shown below.
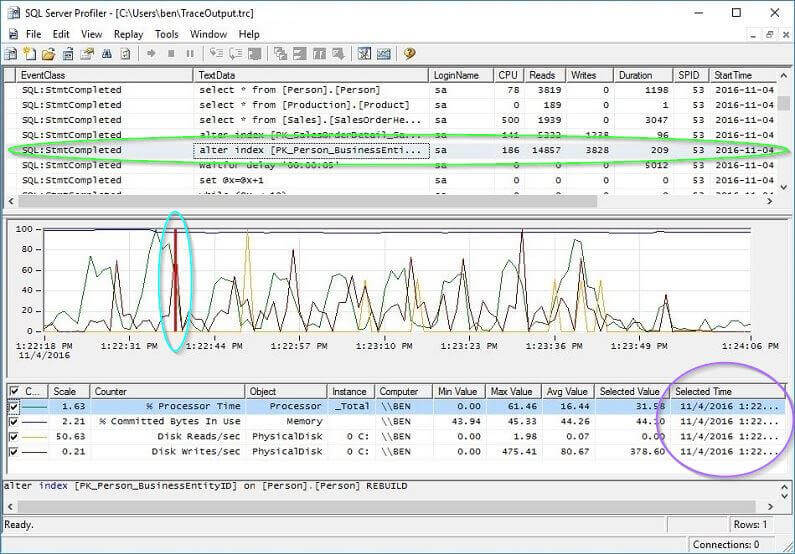
The first window directly below your SQL Trace output is basically the same graph you see if you were to have opened the file containing your performance counters inside Performance Monitor itself. The main difference now is that if you select a query in the profiler output window (shown above highlighted in green) a red bar is placed onto your performance monitor graph (shown above circled in light blue) which gives you a quick indication of the server performance at the time the query was running. There is also an additional window below the graph which gives you the detailed performance counter values for this same time (time is circled in purple above). It also works the other way in that if you click on a part of the graph where the server was under load for a particular counter the red bar is move there and the corresponding query in your SQL Trace output is highlighted.
Next Steps
- Read other tips on SQL Profiler
- How to set Data Collector
- Other ways to collect Performance Monitor counters
- Collect SQL Server Performance Counter Sets Using Logman
- Collect SQL Server Performance Counters and Build Reports with SSRS
- Automate Performance Monitor Statistics Collection for SQL Server and Windows
- Collection Performance Counters and Using SQL Server to Analyze the Data
- Collect and Store Historical SQL Server Performance Counter Data with DMVs


About the author
 Ben Snaidero has been a SQL Server and Oracle DBA for over 10 years and focuses on performance tuning.
This author pledges the content of this article is based on professional experience and not AI generated.
View all my tips
