Problem
You have about 100 SQL Servers installed in your production environment. You have performance problems on few of the servers, but they happen during the time when you are not watching the servers. So, how can you automate performance statistics collection on all the servers around the clock so we have the statistics for 24/7/365.
Solution
You can use the built-in windows utility “logman” that comes free.
Logman is the command line utility for Perfmon. Thru logman, it is easy to automate perfmon data collection which I will show you below.
Data Collection
First, we need to identify what Objects and Counters we need. From my experience, the below counters are good from a SQL Server point of view. We can automate creating one perfmon log file for each day. Then move the old files to a network share for later reference.
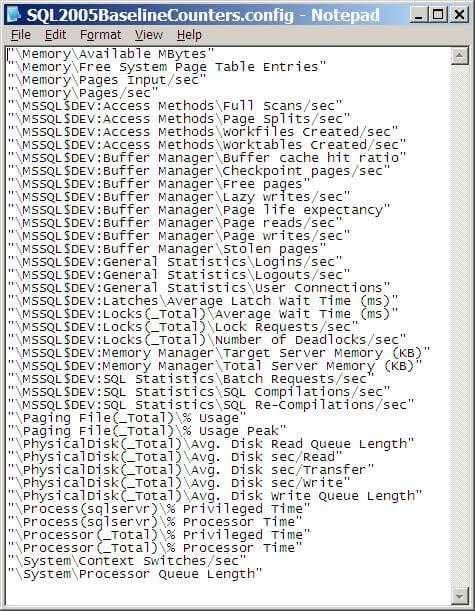
Cut and paste the contents below to a file name “SQL2005BaselineCounters.config” and save the file in “E:\perflogs”. You can choose any local drive/folder, make sure there is enough space in it. Try not to use the same storage that your SQL Server databases use, because this can slow down your I/O throughput.
Note in the below code I am collecting SQL Server data for an instance named “MSSQL$DEV”. This will need to be replaced for your server. If you just have a default instance this will just be “SQLServer“| “\Memory\Available MBytes” “\Memory\Free System Page Table Entries” “\Memory\Pages Input/sec” “\Memory\Pages/sec” “\MSSQL$DEV:Access Methods\Full Scans/sec” “\MSSQL$DEV:Access Methods\Page Splits/sec” “\MSSQL$DEV:Access Methods\Workfiles Created/sec” “\MSSQL$DEV:Access Methods\Worktables Created/sec” “\MSSQL$DEV:Buffer Manager\Buffer cache hit ratio” “\MSSQL$DEV:Buffer Manager\Checkpoint pages/sec” “\MSSQL$DEV:Buffer Manager\Free pages” “\MSSQL$DEV:Buffer Manager\Lazy writes/sec” “\MSSQL$DEV:Buffer Manager\Page life expectancy” “\MSSQL$DEV:Buffer Manager\Page reads/sec” “\MSSQL$DEV:Buffer Manager\Page writes/sec” “\MSSQL$DEV:Buffer Manager\Stolen pages” “\MSSQL$DEV:General Statistics\Logins/sec” “\MSSQL$DEV:General Statistics\Logouts/sec” “\MSSQL$DEV:General Statistics\User Connections” “\MSSQL$DEV:Latches\Average Latch Wait Time (ms)” “\MSSQL$DEV:Locks(_Total)\Average Wait Time (ms)” “\MSSQL$DEV:Locks(_Total)\Lock Requests/sec” “\MSSQL$DEV:Locks(_Total)\Number of Deadlocks/sec” “\MSSQL$DEV:Memory Manager\Target Server Memory (KB)” “\MSSQL$DEV:Memory Manager\Total Server Memory (KB)” “\MSSQL$DEV:SQL Statistics\Batch Requests/sec” “\MSSQL$DEV:SQL Statistics\SQL Compilations/sec” “\MSSQL$DEV:SQL Statistics\SQL Re-Compilations/sec” “\Paging File(_Total)\% Usage” “\Paging File(_Total)\% Usage Peak” “\PhysicalDisk(_Total)\Avg. Disk Read Queue Length” “\PhysicalDisk(_Total)\Avg. Disk sec/Read” “\PhysicalDisk(_Total)\Avg. Disk sec/Transfer” “\PhysicalDisk(_Total)\Avg. Disk sec/Write” “\PhysicalDisk(_Total)\Avg. Disk Write Queue Length” “\Process(sqlservr)\% Privileged Time” “\Process(sqlservr)\% Processor Time” “\Processor(_Total)\% Privileged Time” “\Processor(_Total)\% Processor Time” “\System\Context Switches/sec” “\System\Processor Queue Length” |
Next step is to create a counter log in perfmon which will use the above counters. From a command prompt, execute the statement below on your SQL Server box.
| logman create counter SQL2005Perf -f bin -b 01/01/2009 00:00:05 -E 01/01/2009 23:59:00 -si 05 -v mmddhhmm -o “E:\perflogs\SQL2005Perf” -cf “E:\perflogs SQL2005BaselineCounters.config” -u domain\username * |
You will be prompted for the password

This will create a new counter log named “SQL2005Perf”. To verify this, open perfmon and click “counter logs” under Performance logs and alerts.

Here is the notes for each option used above:
- SQL2005Perf – name of the counter log
- -f bin – binary format, with a .blg extension
- -b 01/01/2009 00:00:05 – begin data and time, input a datetime to start the counter log at a later time, if you input a datetime that is past, the counter log will start immediately
- -E 01/01/2009 23:59:00 – end date and time
- -si 05 – 5 second interval
- -v mmddhhmm – filename will be named as SQL2005Perf_mmddhhmm.blg
- -o “E:\perflogs\SQL2005Perf” – output folder name
- -cf “E:\perflogs\SQL2005BaselineCounters.config” – config file name with the counters
- -u domain\username * – the * will prompt for the password for the domain user account.
You can manually start and stop the above counter logs with below commands:
| Logman start SQL2005Perf Logman stop SQL2005Perf |
To get a list of all your counter logs you can run this command.
| Logman query |
Automate Data Collection
It would be nice if we have performance data for each day. This can be done by stopping the counter log at 11:59:59 PM and again starting it at 12:00:01 AM daily. Once you stop the counter log the log file is closed and starting the counter log creates a new log file.
Lets create a scheduled task which will do this.
Lets first create a batch file “StopCopyStart.bat” that will be executed by the scheduled task. Copy the contents below and save it in the folder “E:\perflogs”. Make sure to change the “Servername”, “SourceServerName” to match your servers.
| logman stop sql2005perf sleep 1 move E:\perflogs\SQL2005Perf\*.blg \\Servername\E$\perflogs\SourceServerName sleep 1 logman start sql2005perf |

| schtasks /create /tn “Stop Copy And Start SQL2005Perf Perfmon Counter Log” /tr E:\perflogs\StopCopyStart.bat /sc daily /st 23:59:58 /ed 01/01/2099 /ru system |

- schtasks /create – create a new scheduled task
- /tn “Stop Copy And Start SQL2005Perf Perfmon Counter Log” – scheduled task name
- /tr E:\perflogs\StopCopyStart.bat – run this batch file
- /sc daily /st 23:59:59 – schedule time
- /ed 01/01/2099 – end date
- /ru system – user account
A new scheduled task with name “Stop Copy And Start SQL2005Perf Perfmon Counter Log” will now be created. From the command prompt type “schtasks”, this will list all the scheduled tasks.
Next Steps
- The idea is to move the performance data .blg file from each of the SQL Server to a common share. Create one folder for each server and move the .blg file there. So, the user account to execute the scheduled task should have permissions on the share where we move the performance log file.
- You should do some housekeeping on this network share to delete files older than 30 or 60 days.
- Always have one week ( one file for each day of week ) performance data for each server to be used as a baseline. If you have any performance problems you can compare with the baseline.

Ranga Narasimhan has been in IT for about 10 years. He started as a Visual Basic / Crystal Reports developer and then started coding in SQL Server. He has been a SQL Server developer and for the last few years doing SQL server production support operations. In his last job, Ranga was the primary DBA for the Siebel call center database and has learned a lot from the challenges that a very large database can bring and an application where queries are built dynamically. He enjoys spending time with his family. His interests are playing tennis and golf.