Problem
For years, Alex, a DBA, and his team managed only a few SQL Server instances. After the acquisition, everything changed. They were responsible for monitoring more than two dozen SQL Servers, both on-premises and in Azure. Query Store and built-in DMVs weren’t going to cut it at this scale, even though the team valued them and still does. They also didn’t want to invest significant time in building their own monitoring solution. They needed something now.
With so many SQL Server enterprise monitoring solutions on the market, which one should Alex’s team turn to?
Solution
That is when Alex’s team turned to SQLGrease, a trusted enterprise monitoring tool that lets the team monitor dozens (or hundreds) of SQL Server instances from a single place. Now, they no longer rely on Query Store or one-off DMV checks as their primary approach. SQLGrease is the command center for the entire SQL Server fleet.
For Alex’s team, monitoring a multi-instance SQL Server estate with SQLGrease is faster and more reliable than using ad-hoc native checks or a custom solution.
Introducing SQLGrease

At its core, SQLGrease is a fully managed cloud monitoring tool that delivers deep insights into the performance of your SQL Server. Here’s the thing: SQLGrease allows you to focus on solving performance problems rather than wasting time finding them.
You might be wondering why we can’t use native SQL Server tools such as Query Store, DMVs, and Extended Events. You can, and many teams still do, for specific situations, but at scale, Alex’s team needed a single place to see what’s happening across every server.
Buy vs. Build
It’s tempting to download complex DMV scripts from experienced SQL authors and roll your own monitoring solution. But once you get serious, DMVs alone usually aren’t enough. You end up leaning on Extended Events, PowerShell, and Query Store. Adding a new database is a pain, and adding a new instance is even worse.
You might pull that off for one or two SQL Servers, but good luck doing it for 100.
And the custom route is often time-consuming and fragile. If the documentation isn’t airtight, the next person who inherits your custom solution will hate it and might abandon it altogether. In the long run, a homegrown solution can cost more than it saves. Bottom line: SQLGrease works from day one to help you find performance issues.
Why You Should Choose SQLGrease
Alex’s team needed to monitor and troubleshoot performance across multiple SQL Server instances, but a native-only approach didn’t scale. So why SQLGrease? Here are a few reasons.
- Capture Key Performance stats
- Ease of installation
- Single intuitive interface
- Continuous monitoring and historical trends
- Robust alerting and notifications
- Minimal security requirements
- Secure transfer of performance data
- Flexible licensing
Now let’s spend a few minutes looking at each of these.
Capture Key Performance Data

After decades of working with data, Alex is obsessive about tracking the basics. SQLGrease makes collection easy. Now, it might be easier for Alex to list what SQLGrease doesn’t collect. Here are the ones he checks most often:
- Frequently executed queries by CPU, duration, reads, and writes
- Wait stats and wait trends
- Excessive blocking and deadlocks
- Detailed query analysis
- Regression in query plans
- Job failures and slow jobs
- Temp DB pressure
- Database growth
- Activity from other databases or apps (a “noisy neighbor”)
The items above are just the tip of the iceberg. Check out the complete feature list on the SQLGrease Feature page.
When a production server is under load, Alex can quickly review the metrics above to determine whether it’s a CPU-intensive query, excessive blocking, or Temp DB under pressure. With SQLGrease, Alex can easily identify anomalies rather than sift through large volumes of raw data, which is like looking for a needle in a haystack.

Easy to Install
SQLGrease is a SaaS solution, which means the vendor fully manages it. Since SQLGrease agents run outside your SQL Server instance, you do not need a SQL Server license to manage or monitor them. You get new features without upgrading anything on your end. That’s a lot easier than building, deploying, and maintaining scripts across a fleet of SQL Server instances.
The installation wizard takes only a few minutes, and you will start collecting data in no time. When installing SQLGrease, you can sanitize data, which is critical for protecting sensitive data in queries, execution plans, and related items. If you’re unsure whether to sanitize a production instance, default to yes. Additionally, SQLGrease automatically sanitizes performance data before moving it to the centralized performance warehouse.
With so much focus on data breaches in the media, you don’t want to be in the spotlight.
Single Intuitive Interface

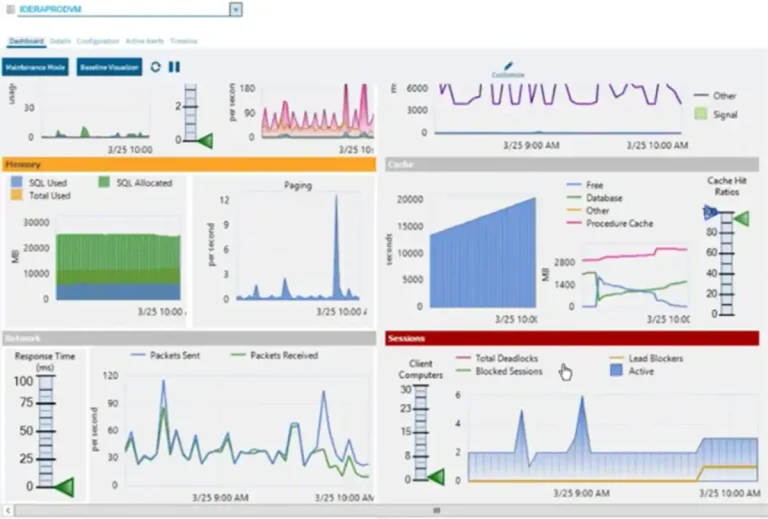
Instead of juggling multiple tools and reports, Alex can go directly from a high-level dashboard to the problem query in just a few clicks. This workflow matters when you’re supporting dozens of servers, and one comes to a crawl during peak business hours.
Continuous Monitoring and Historical Trending

SQLGrease continuously collects performance data, so you don’t end up with gaps when an issue occurs, and you weren’t capturing it at the time. It also stores historical data and trends, making it easier to investigate past incidents and identify performance changes over time.
There’s nothing worse than getting an email from a business user saying, “Three days ago, around 5:00 pm, the application was slow.” SQLGrease is like a time machine that lets you go back an hour or a week to see what activities were happening. You don’t need to guess or write off the user’s experience as a fluke.
Alerting and Notifications

Don’t wait for an end user to report that something is slow. SQLGrease supports alerts and notifications, so you’re notified when a threshold is crossed. Alerts are configured by default, and you can adjust the rules in the UI as your workload changes.
Automated alerts are critical for proactively fixing issues before end users even notice them. They also save time, so you don’t need to worry about a flood of fiery emails after the fact.
Minimal Security Required
One thing Alex’s team noticed was that nearly any third-party monitoring tool requires elevated access to your environment. With just VIEW SERVER STATE and VIEW ANY DEFINITION, you’ll have access to all SQLGrease features except the OS performance counters. To monitor OS performance counters, SQLGrease needs sysadmin permissions on the instance.
If you’re concerned about security, don’t worry. The monitoring agent uses HTTPS to communicate with the SQLGrease cloud service. Traffic is outbound-only, so no inbound firewall ports are required on your network.
Affordable and Flexible Licensing
When you propose a new monitoring tool to executives, the first questions are what it costs and what the licensing looks like. SQLGrease licensing is flexible (monthly or annually), allowing you to monitor servers only when needed. Pricing is based on the amount of data you store, with adjustable history retention to control costs. You can move to a higher tier as your needs grow.
The pricing tiers are straightforward, and you can view the full pricing list for the Basic, Standard, and Premium plans on the SQLGrease Pricing page. If you have questions, feel free to contact them.
Getting Started with SQLGrease
Do you want to take SQLGrease for a test drive? They make it easy with a 30-day trial. Here’s my advice. Point it at a non-critical instance first, then expand once you’re comfortable. When you’re ready to purchase, start with one server and add servers as needed. As you expand, tune history retention to keep enough data to troubleshoot without storing more than you need.
If you ever feel stuck, SQLGrease offers support from its dedicated team of engineers who build and improve the product. They are just one email or phone call away, ready to help you get up and running.
With the 30-day trial, what do you have to lose?
Next Steps
- I like to get a feel for something before trying it out, like a trailer before committing to the full movie. Do you want to see SQLGrease in action? Check out engaging videos on the Demos page.
- Would you like to see a detailed list of the features collected by SQLGrease? Then take a look at the Features page. A few of my favorites include Query Response Times and Query Deadlock Analysis.
- Are you ready to take the first step? Then sign up for a 30-day free trial and start tracking some of the most important stats, such as Query CPU Time, IO, and Temp DB usage.

Jared Westover is a SQL Server specialist with two decades of industry experience covering T-SQL development, performance tuning, administration and Microsoft Fabric. He is currently a software architect at Crowe, an author at Pluralsight and primary contributor at sqlhabits.com. On MSSQLTips.com, Jared is a respected award-winning author for his clever T-SQL solutions and bringing to light new real-world solutions to age-old development problems.
- MSSQLTips Awards
- Achiever Award (75+ tips) – 2026
- Author of the Year – 2023
- Author Contender – 2024/2025

Great info