By: Siddharth Mehta
Overview
Finally once the system in up running smoothly in production, the last and continuous step for a SQL Server Analysis Services (SSAS) administrator is to keep monitoring the server performance for any performance issues and/or bottlenecks. We are going to discuss the tools that enable a SSAS admin to monitor SSAS performance from different aspects.
Explanation
SSAS performance can be monitored by different native tools which include:
- SQL Server Profiler and Extended Events
- Performance Monitor Tool (perfmon)
- Flight Recorder
We will discuss Profiler and Performance Monitor as well as performance counters in this chapter. Flight Recorder would be discussed in the next chapter.
Using Profiler with Analysis Services
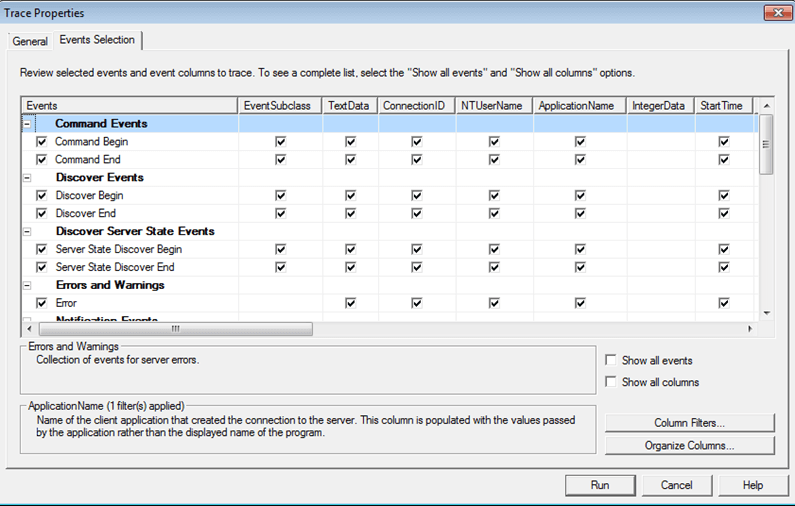
SQL Server Profiler can be used to monitor events generated by SQL Server Analysis Services. The key advantages of using Profiler is that it can be used to trace MDX queries being executed on the server, as well as the events can be recorded for auditing and can even be replayed in future for simulation / analysis. The below screenshot shows the events for a typical SSAS trace.
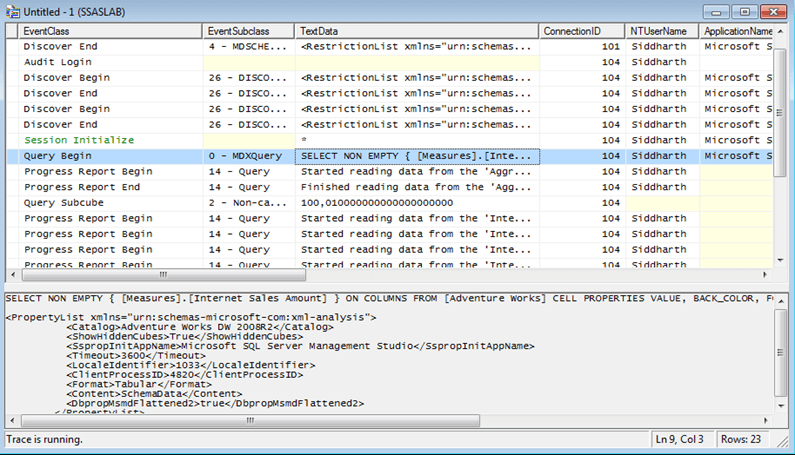
Once the trace is running, it's very easy to identify any particular MDX query being executed on the server along with its performance. The below screenshot displays the MDX query that was intercepted by Profiler.
Extended events is another built-in light-weight method of intercepting a live trace of SSAS events, as compared to SQL Profiler. You can read more about it here.
Using Performance Counters to monitor SQL Server Analysis Services
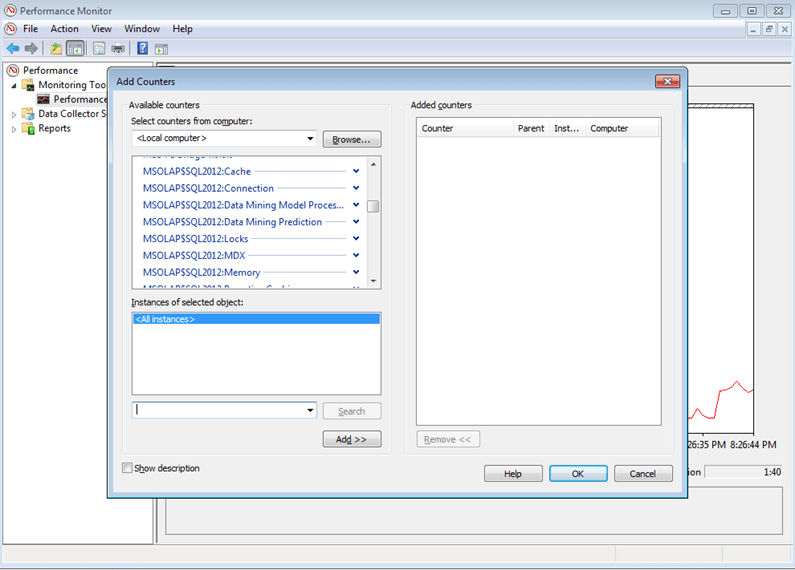
Any seasoned SSAS developer or SQL Server DBA would be aware of the Performance Monitor utility, which is popularly known as Perfmon. At a high level, its a utility that tracks server and process performance using performance counters. SSAS comes with a huge number of performance counters that can be classified in a variety of categories. You can get details about each and everyone of them by reading this article. Once you use Perfmon to connect to SSAS server, you should be able to see the corresponding performance counters and use the same for monitoring server performance.
Additional Information
- Profiling or monitoring analysis service performance requires a reasonable level understanding of the analysis services trace events. Consider reading this article for more information.
