By: Siddharth Mehta
Overview
Every project should start with a thorough requirements analysis phase. If the project is outsourced, before the project is awarded to a vendor, different pre-sales activities takes place which are outside the scope of this tutorial. We will consider it turned over to the technology team once the project has been initiated and at that point in time the development team has been asked to kick-off the technical aspects of the project. Business Analysts are typically positioned closed to the clients to understand the functional requirements and the technical team works with the Business Analysts to translate the needs into technical requirements. In this section of the tutorial we will discuss different aspects of the requirements analysis.
Explanation
Requirements analysis is thought to be the job of only a business analyst, but it reality it is a collective team effort. Everyone needs to collect requirements for their own set of tasks and deliverables. In a Business Intelligence project, one needs to have some high level understanding of a standard BI architecture. A clear understanding of the architecture helps to identify the right areas for requirement analysis. We will consider a business scenario that we will use as our project requirements for the rest of the tutorial, and corresponding to that, we will start looking at a typical BI architecture that addresses the project requirements.
Business Scenario
AdventureWorks is a fictitious company that manufactures Bikes as well as related clothing and accessories. The company conducts business globally and has sales in Europe, North America as well as Asia-Pacific. AdventureWorks wants to move away from paper-based and manual processes, and wants to have an online system that stores the data in a relational database. Each business unit from every geographical location would access the online system and manage sales and order related data that would be stored in a central data repository. This centralized data repository should act as the one-stop-shop for all the data related needs of the company, as the company grows and adds more sources of data in the future.
Different countries have different regulations and compliance requirements. Hence different types of reports have to be developed to enable immediate, short-term and long-term reporting requirements. As the company has many sales executives who travel frequently to conduct business, the reports should be accessible from smart devices. The CEO of the company is the key sponsor and user of reporting, and is interested in deriving sales analytics from the data. A team of data analysts would be accessing the data to create reports on-demand, as required by the CXOs of the company. They need to be able to slice and dice the data for detailed analysis.
Business Intelligence Architecture
For now, let us keep in mind the business scenario and look at a typical end-to-end BI architecture. We will discuss requirements gathering and time estimations for this scenario in the next section. The below diagram shows a typical BI architecture. Each entity in the diagram represents a different layer and/or function of the solution. Generally a technology / business intelligence architect would develop the solution / technology architecture based on the project requirements.
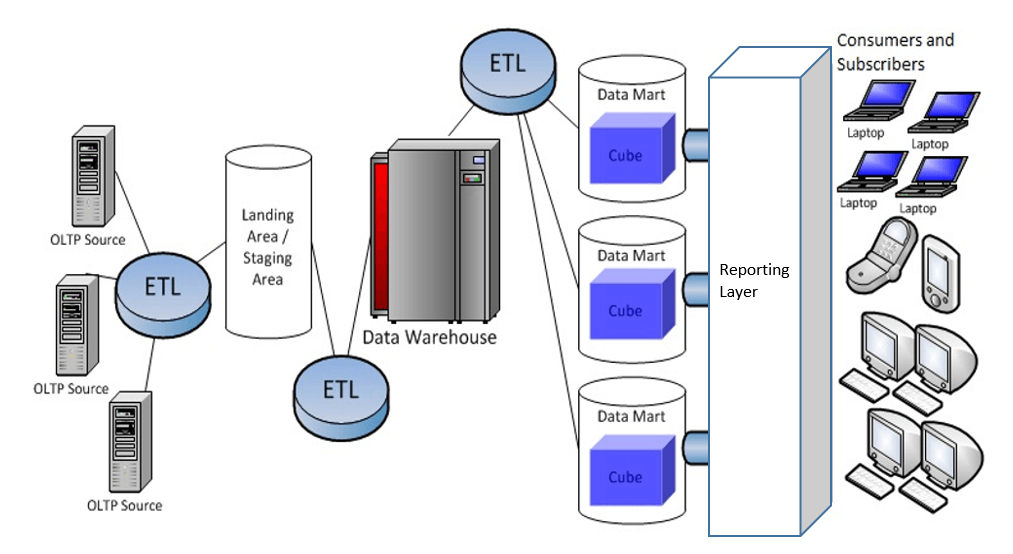
- Source System - Typically data is extracted from OLTP source systems. Data is stored in these systems using application front-ends. In some cases data is stored in file-based data sources like Excel spreadsheets too.
- Staging / Landing Area - Data is extracted from source systems and an identical or transformed copy of the data is gathered on a centralized platform commonly referred to as a staging area. Data collected in staging area may be cleansed and transformed by applying business rules and stored into yet another storage area called the landing zone. Reading data from transactional systems would adversely affect the performance. There are other factors such as requiring de-coupling transactional systems from reporting systems, hence a copy of the data is staged at regular intervals.
- ETL - The process of extracting, transforming and loading data from one system to another, popularly known as ETL, is often used as the data movement vehicle in BI projects. SQL Server Integration Services is the Microsoft BI Technology to meet ETL requirements.
- Data Warehouse - As data continuously gets accumulated and different kinds of data requirements keep evolving in the enterprise, it becomes necessary to warehouse the data. A data warehouse acts as a central data repository for any data related needs of an enterprise. There can be multiple source systems in an enterprise, but data is ideally stored in a single centralized data warehouse.
- Data Mart - Depending upon the data analysis need of any given business department, business-specific data marts would be created. A data mart in simplified terms means a sub-section of the data warehouse that is used for analysis. Typically OLAP (Online Analytical Processing) technologies are employed to create a data mart, like SQL Server Analysis Services. The volume of calculations on the voluminous amount of data mandates the use of OLAP technology as relational databases are not well suited to meet the performance needs of such a solution. The most recognizable implementation of an OLAP is in the form of a cube, similar to databases in the relational world.
- Reporting - The flow of data within any application may
start with different forms of data collection methods, and mostly ends with
some kind of reporting. SQL Server Reporting services is the commonly used reporting technology
in the Microsoft BI stack. Reports can be operational, analytical or strategic
and may be consumed by desktops, tablets and mobile devices too. Reporting can
be as simple as an operational report formed of a few rows and columns, and can
be as complex as a dashboard composed of scorecards, geo-spatial analysis, charts,
graphs, data matrix with drill-down and drill-through. We will look at these
aspects in the reporting section of the tutorial.
Additional Information
- Consider reading this article to get more idea on how and why BI systems evolved and the limitations with traditional OLTP databases.
