By: Siddharth Mehta
Overview
Large volume data manipulation tasks are generally preferred to be done in T-SQL and with the help of R we can also do special tasks like statistical computing, machine learning, natural language processing and more.
Consider a use case where we need to calculate statistics of quantitative data from a table stored in a sample database hosted on an instance of SQL Server 2017 CTP2. Preliminary data analysis and exploration for machine learning generally starts with descriptive statistics. For calculations of basic numeric parameters like mean, median, quartiles, etc. and charts like Histograms, Scatterplots, and Boxplots, can be analyzed side by side with these statistics.
Our intention is to learn how to derive these statistics using T-SQL and R for a quantitative and voluminous data stored in SQL Server table.
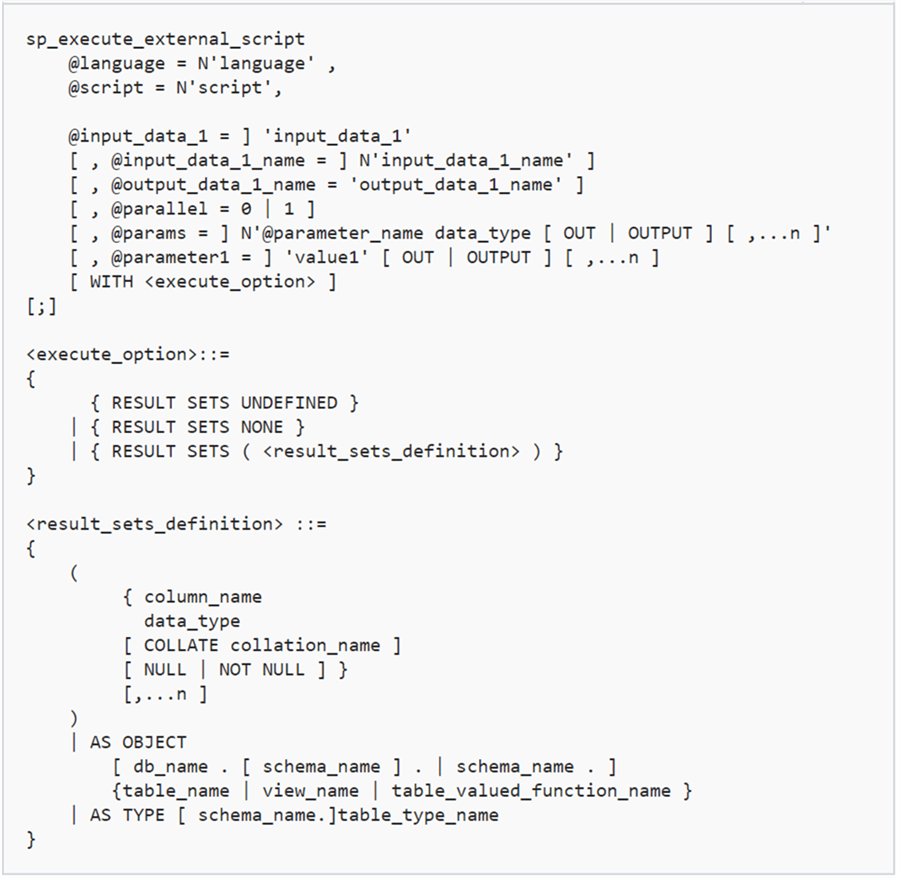
SP_EXECUTE_EXTERNAL_SCRIPT
We already saw the use of this procedure in previous lessons. Below is the syntax. You can read more details about its use here. Some points to note about the use of this command are as follows.
- External script execution has to be enabled on the instance of SQL Server as discussed in an earlier lesson.
- The @language parameter should have the language specified as R to execute R scripts.
- You can specify the input datasets query and name using the relevant input parameter (@input_data_1 and @input_data_1_name). If you do not provide a name for input dataset, the default name will be used i.e. “InputDataSet”.
- You can also specify a name for the output dataset, if not specified, the default name will be used i.e. “OutputDataSet”.
- In order to fetch the output data in result set, you need to use the keyword WITH RESULT SETS and provide the definition of the output data.
Data Exchange Between R and T-SQL
Let’s try to understand the above points with an example. Let’s say we have the sample AdventureWorks data warehouse. Fact tables generally hold quantitative data and dimension tables hold qualitative data. So naturally fact tables are a good fit for statistical analysis. The most relevant numeric data would be related to sales in the AdventureWorks DW database.
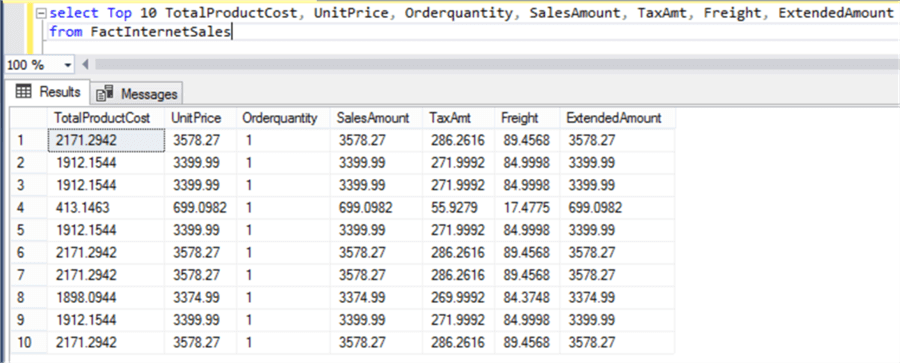
Consider a use-case where we want to calculate basic descriptive statistics of some fields holding numerical values with minimal amount of code and complexity. For this we will be passing our data to R for calculation and will be fetching the calculated output from R into T-SQL. The FactInternetSales table contains more than 60k records related to sales data. With a single line of code in R we can calculate all these statistics as shown in the below example.
Let’s understand what this example does and how data is exchanged between R and T-SQL.
- First, we are using the sp_execute_external_script command with @language parameter specified as R.
- In the @script parameter we are specifying the R script. It contains two lines, of which the first line is commented using the # character.
- In the @input_data_1, the T-SQL query has been specified which fetches the relevant fields from the FactInternetSales table.
- In the last part of the query, the “with result sets” keyword specifies that the output result set is expected and the schema of the output data set has been specified.
- The commented line of code demonstrates how the fields from the input dataset can be accessed inside R. Using the $ sign with the name of the input dataset (in this case the default name is used – InputDataSet), we can access any fields of the input data inside the R script.
- If you read the description regarding the use of sp_execute_external_script command, it is mentioned that the input and output dataset are expected to be in the form of a data frame in R. A data frame is data structure in R which is synonymous to a table in SQL Server. InputDataSet by default is sent in the form of a Data Frame to R. OutputDataSet may need to be converted to a DataFrame.
- R contains a built-in function named “summary” to calculate basic statistics of a dataset. We are passing the input data to this function, converting the output to a data frame using the “data.frame” function and assigning the result to the output stream using the default output name i.e. “OutputDataSet”.
The end output is the calculation of min, max, median, mean, 1st quartile and 3rd quartile. The formula and significance of these statistics is beyond the scope of this tutorial. These are very basic calculations and those dealing with data analysis and data science should already know this. Those who are new to this can consider searching this on Wikipedia, and you should be able to easily find a lot of free information.
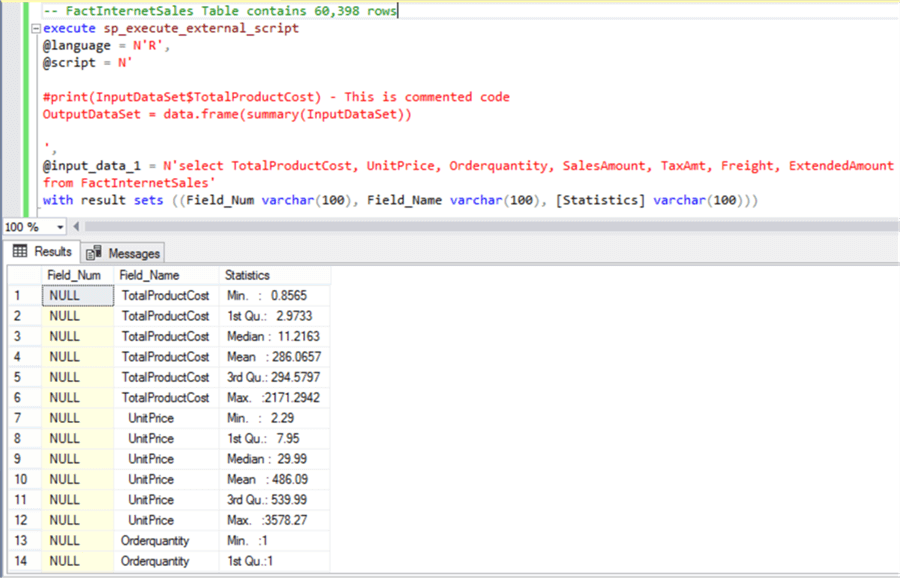
The output is not very gracefully formatted and can be changed to capture each statistic in a separate field. Here our intention is just to demonstrate how we can calculate all these statistics with a single line of code in R. Consider achieving this output in T-SQL and then you can assess the complexity of this implementation in T-SQL versus R.
-- FactInternetSales Table contains 60,398 rows
execute sp_execute_external_script
@language = N'R',
@script = N'

#print(InputDataSet$TotalProductCost) - This is commented code
OutputDataSet = data.frame(summary(InputDataSet))

',
@input_data_1 = N'select TotalProductCost, UnitPrice, Orderquantity, SalesAmount, TaxAmt, Freight, ExtendedAmount
from FactInternetSales'
with result sets ((Field_Num varchar(100), Field_Name varchar(100), [Statistics] varchar(100)))
Now that we understand how the statistical power of R can be applied to datasets fetched from SQL Server data repositories using T-SQL, the next logical step is to derive some insights about data using visualizations. Let’s move on to the next lesson to learn more.
Additional Information
- Consider developing logic in T-SQL to achieve the same output that we got from R in the above example to assess how using R in T-SQL can simplify the complexity of these calculations.
