Overview
A large volume of data manipulation tasks are generally preferred to be done in T-SQL. As we discussed in the first lesson, it would make sense to leverage Python for special tasks like statistical computing, machine learning, natural language processing, etc. Consider a use case where we need to calculate statistics of quantitative data from a table stored in a sample database hosted on an instance of SQL Server 2017. Preliminary data analysis and exploration for machine learning generally starts with descriptive statistics. For the same calculation of basic numeric parameters like mean, median, quartiles, etc. Charts like Histogram, Scatterplot, and Boxplots, etc. are analyzed side by side with these statistics.
Our intention is to learn how to derive these statistics using T-SQL and R for a quantitative and voluminous data stored in a SQL Server table.
Explanation
SP_EXECUTE_EXTERNAL_SCRIPT
We already saw use of this procedure in the previous lessons. Below is an explanation of the syntax. You can read more details about its use from here. Some points to note about the use of this command:
- External scrips execution should have been enabled on the instance of SQL Server as discussed in the earlier lesson.
- The @language parameter should have the language specified as R to execute R scripts
- You can specify input datasets query and name using the relevant input parameter (@input_data_1 and @input_data_1_name). If you do not provide a name for input dataset, the default name would be used i.e. “InputDataSet”.
- You can also specify a name for output dataset, in rather case, the default name would be used i.e. “OutputDataSet”.
- In order to fetch the output data in result set, you need to mention the keyword WITH RESULT SETS and provide the definition of the output data.

Data Exchange between Python and T-SQL
Let’s try to understand the above points by means of an example. Let’s say that we have the sample AdventureWorks data warehouse. Fact tables generally hold quantitative data and dimensions tables hold qualitative data. So naturally fact tables are a good fit for statistical analysis. The most relevant numeric data would be related to sales in the AdventureWorks DW database.

Consider a use-case where we want to calculate basic descriptive statistics of fields holding numerical values with a minimal amount of code and complexity. To do so, we would pass our data to Python for calculations and would be fetching the calculated output out of Python into T-SQL. The FactInternetSales table contains more than 60k records related to sales data. With a single line of code in Python we can calculate all these statistics as shown in the below example. Let’s understand what this example does and how data in exchanged between Python and T-SQL.

- First, we are using the sp_execute_external_script command with @language parameter specified as Python.
- In the @script parameter we are specifying the Python script.
- In the @input_data_1, the T-SQL query has been specified which fetches the relevant fields from the FactInternetSales table. The fields that have money datatype are converted to float, as money is not a supported datatype with Python.
- In the last part of the query, the “with result sets” keyword specified that the output result set is expected and the schema of the output data set has been specified.
- If you read the description regarding the use of sp_execute_external_script command, it is mentioned that the input and output dataset are expected to be in the form of a data frame in Python. A data frame is data structure in Python which is synonymous to a table in SQL Server. InputDataSet by default is sent in the form of a Data Frame to Python. OutputDataSet may need to be converted to a DataFrame. Data Frame structure is contained in a library called Pandas. So we have imported this library at the start of the script using the import keyword.
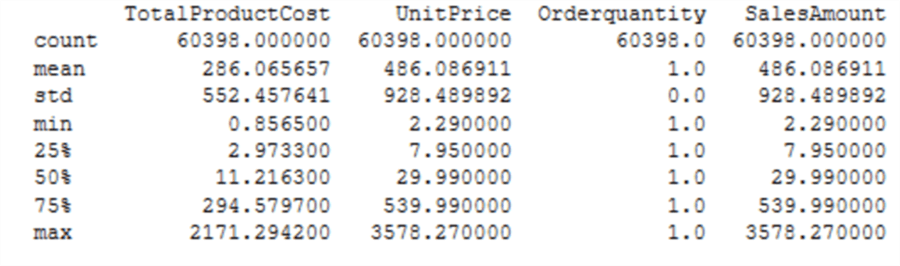
- Data Frame structure contains a built-in function named “describe” to calculate basic statistics of a dataset. We are passing the input data to this function, converting the output to a data frame using the “DataFrame” function and assigning the result to the output stream using the default output name i.e. “OutputDataSet”.
The end output is the calculation of count, mean, standard deviation, min, max and quartiles like 25%, 50% and 75%. The formula and significance of these statistics is beyond the scope of this tutorial. These are very basic calculations and those dealing with data analysis and data science would already know this. Those who are new to these formulas can search for them on Wikipedia and you should be easily able to find a lot of free information on each formula.
Here our intention is just to demonstrate how we can calculate all these statistics with a single line of code in Python. Consider achieving the same output in T-SQL and then you can assess the complexity of the implementation in T-SQL versus Python.
execute sp_execute_external_script
@language = N'Python',
@script = N'
import pandas as pd
from pandas import DataFrame

OutputDataSet = pd.DataFrame(InputDataSet.describe())

',
@input_data_1 = N'select cast(TotalProductCost as float) as TotalProductCost, cast(UnitPrice as float) as UnitPrice,
Orderquantity, cast(SalesAmount as float) as SalesAmount, cast(TaxAmt as float) as TaxAmt, cast(Freight as float) as Freight,
cast(ExtendedAmount as float) as ExtendedAmount from FactInternetSales'
with result sets ((TotalProductCost float, UnitPrice float, Orderquantity float,
SalesAmount float, TaxAmt float, Freight float, ExtendedAmount float))
Now that we understand how the statistical power of Python can be applied to datasets fetched from SQL Server data repositories using T-SQL, the next logical step is to derive some insights about data using visualizations. Let’s move on to the next lesson.
Additional Information
- Consider developing logic in T-SQL to achieve the same output that we got from Python in the above example to assess how use of Python in T-SQL can simplify the complexity of calculations.

Siddharth has more than 14 years of experience in the IT Industry, with more than a decade of experience in Business Intelligence and Analytics, for clients banking, logistics, government, Media Entertainment, products, life sciences and other domains. He has been a lead architect for a portfolio of 40+ apps, containing apps in web, mobile, BI, Analytics, data warehousing, reporting, collaboration, CMS, NoSQL and other technologies. He has several certifications and is a published author for online and print-media publications, as well as the MSDN Library.
In his present role, he remains responsible for architecture design, technology stack selection, infrastructure design, 3rd party products evaluation and procurement, and performance engineering. These applications use technologies like Elasticsearch / Lucene, MongoDB, SharePoint 2013 and 2010, jQuery-based framework like Highcharts and GoJS, SQL Server and the Microsoft Business Intelligence stack (SSIS, SSAS, SSRS, MDX, PowerPivot, PowerView), jQueryMobile, Bootstrap, iOS xCode framework, and many others.
- MSSQLTips Awards: Champion (100+ tips) – 2018 | Author of the Year – 2017 | Author Contender – 2016, 2018-2019


This functionality is not available in SS2016 – Use PowerShell to trigger python.