By: Scott Murray
Overview
SSRS utilizes a single design grid for designing the layout of a report. When completing the design, the process covers everything from the type of object that is added, to formatting, to the method of paging on a report. The design process utilizes a model which displays a quasi what you see is mostly what you get model; some objects, such as a matrix have expandable cell values for items such as column and row groups. In this tip we will cover the following items:
- Header area, footer area, body area
- Objects
- Column and Row Groups
- Formatting and Properties
- Visibility / toggle
- Paging
- ReportItems
- Images
To start off the process, we will assume that Visual Studio—SSDT-BI is being used and has been opened to a new report, and that the data source(s) have been created along with any necessary parameters.
Report Body, Header, and Foote
The report design grid is divided into three main areas as shown below.
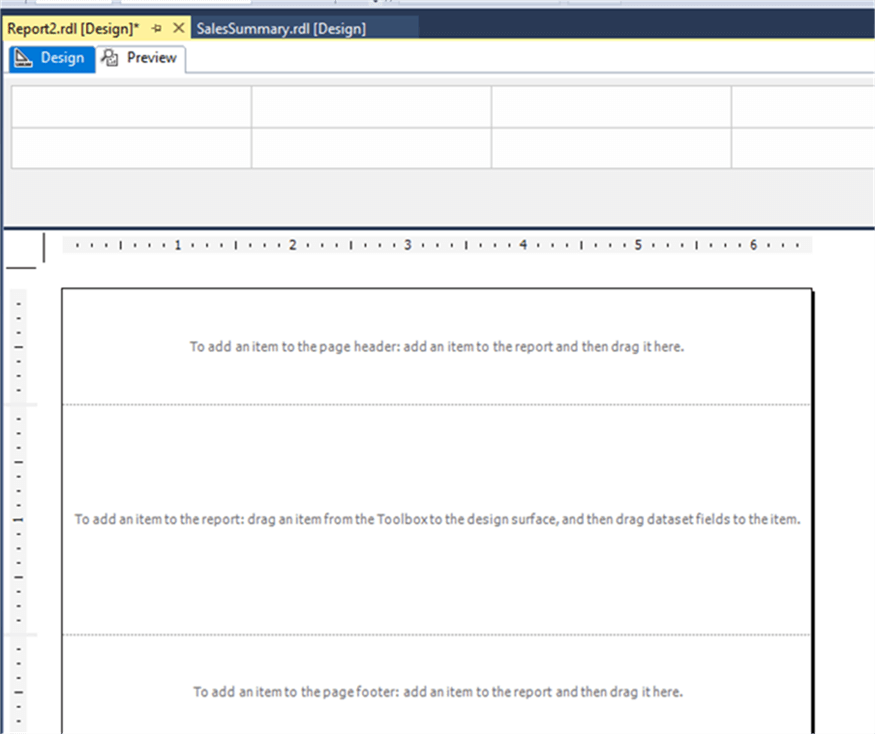
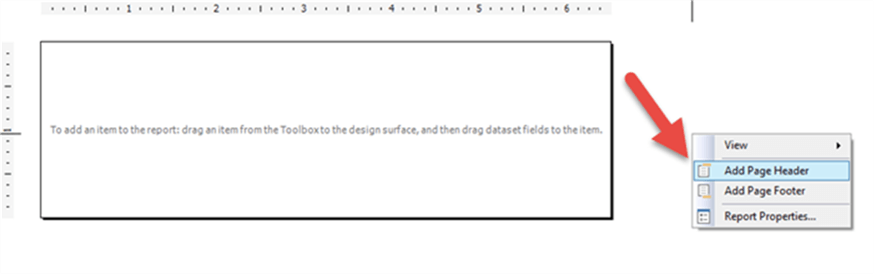
The header and footer areas are actually page header and footers and repeat on each page. Thus, these areas are primarily utilized for items such as a report title, dates, page numbers, and run dates and times. Generally, these items are added to a text box placed in the header or footer area. Also, when a report is first created, the report header and footer sections are not shown by default, only the main report body design window, as illustrated next.
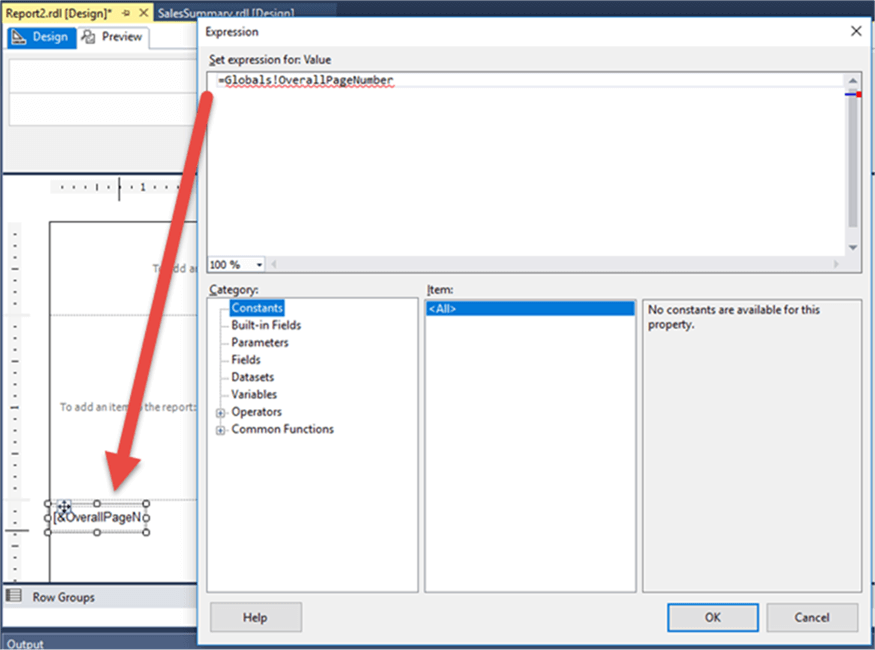
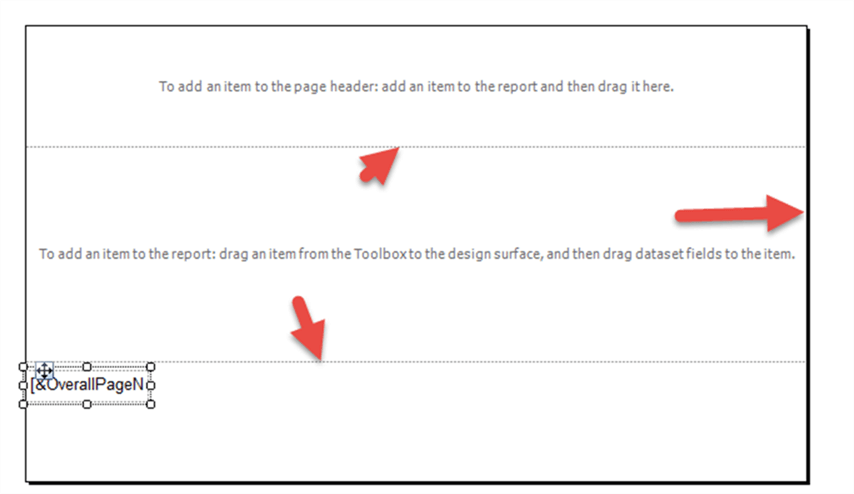
Also, you can easily drop certain system default items such as page number onto the header or footer section, as displayed next.
To change the size (height or width), of these areas, you can click and drag the border between each section or click and drag the right-hand margin (note the overall report size is controlled by report level page width and height properties).
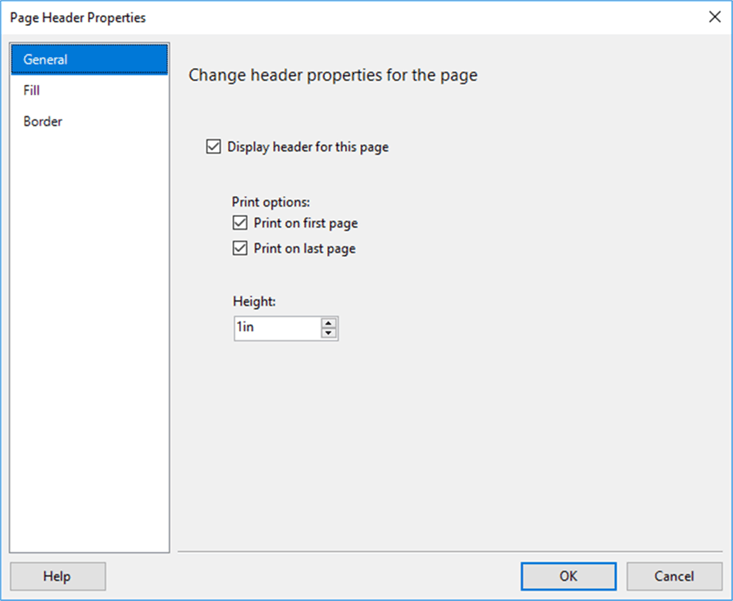
The header and footer properties also allow control of first and last page printing options, and the overall height of the header or footer.
Available Objects
SSRS provides the following objects which can be dropped onto the main report area:
- Matrix \ Tablix – similar to a pivot table
- Table -different than a matrix in that generally you only have row groupings.
- List – similar to a table but only contains columns
- Charts and Gauges and Indicators – a wide variety of the most common charts including the dreaded pie chart
- Sparklines and Databars – these are a special version of the above charges
- Textboxes – perfect for adding a single value especially in page headers and footers
- Rectangles – object is great grouping other objects into grouping
- Lines – good for separating sections within a report
- Subreports – other reports can be embedded within another report
- Images – great for adding a logo
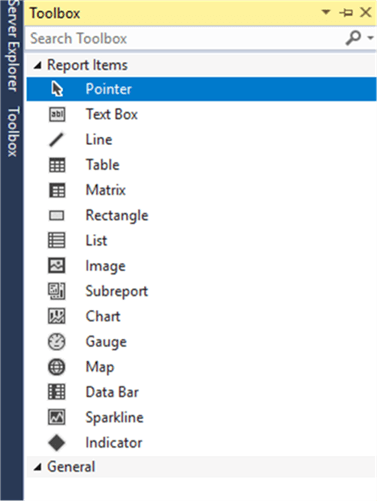
In order add one of the objects, you would click and drag the object from the main SSRS toolbox to the main report design area. The object can be “dropped” anywhere on the grid and can simply be moved to an appropriate location and set to the appropriate size.
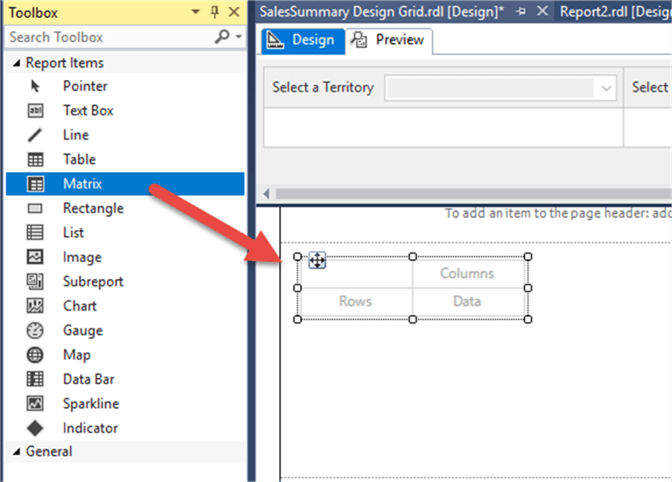
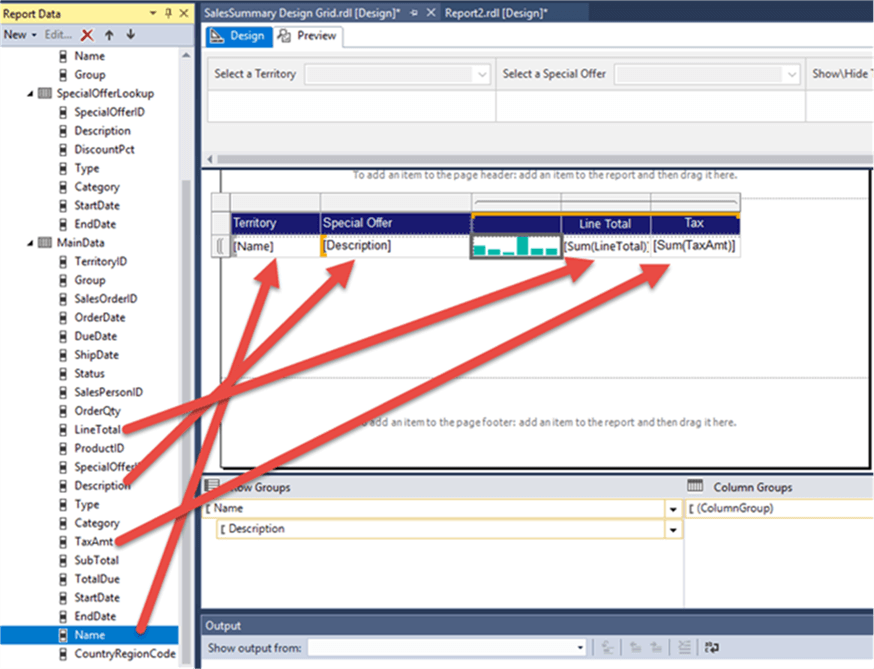
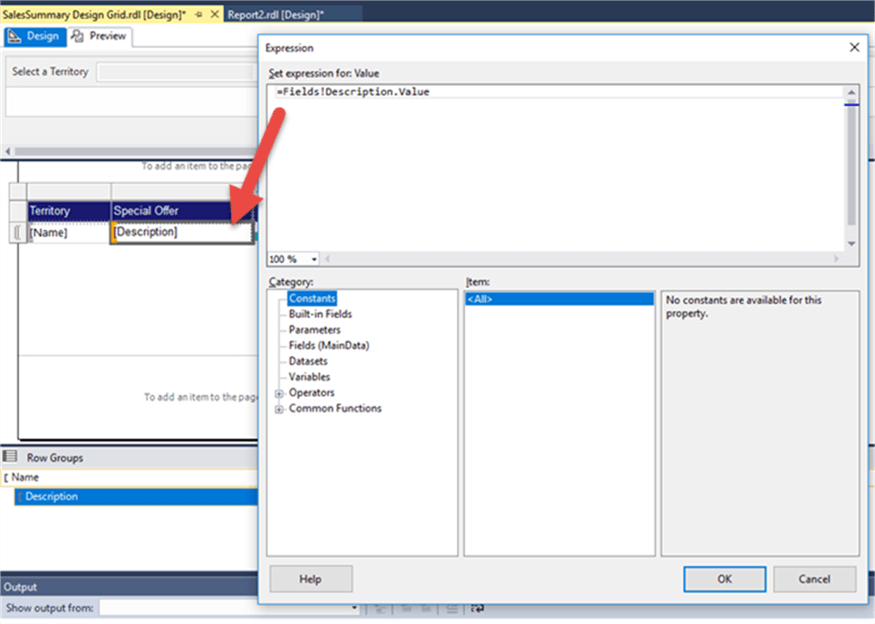
Subsequently, report data items can be easily dragged from the Report Data menu directly onto the matrix or table or other data objects. SSRS automatically determines if a measure field is used and if it should be aggregated (summed). Each field including the headers row can be changed as needed.
Alternately, you can right click on the text box and select the expression option which opens the expression builder.
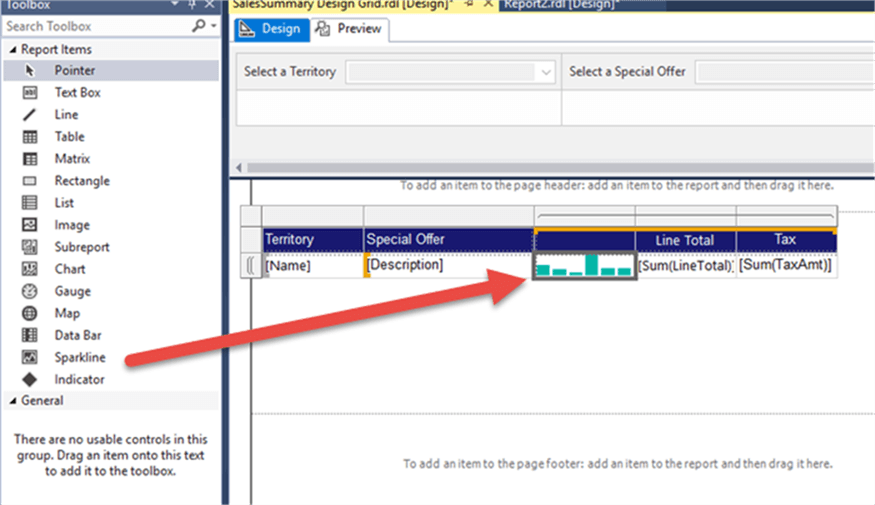
Of course, you can place as many of these objects onto a report as needed, but also many of these objects can also be embedded within other objects. For instance, often you will want to embed a spark line within a matrix (see this tip).
For the bulk of your reporting needs you will find that you will use the matrix and table option for likely 70% to 80% of your reporting. The flexibility these two objects provide with paging, grouping, and formatting caters to the vast majority of the user requirements of a reporting solution.
Column and Row Groups
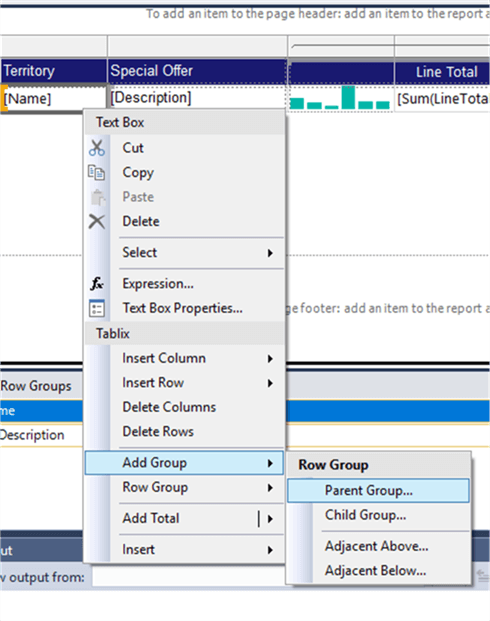
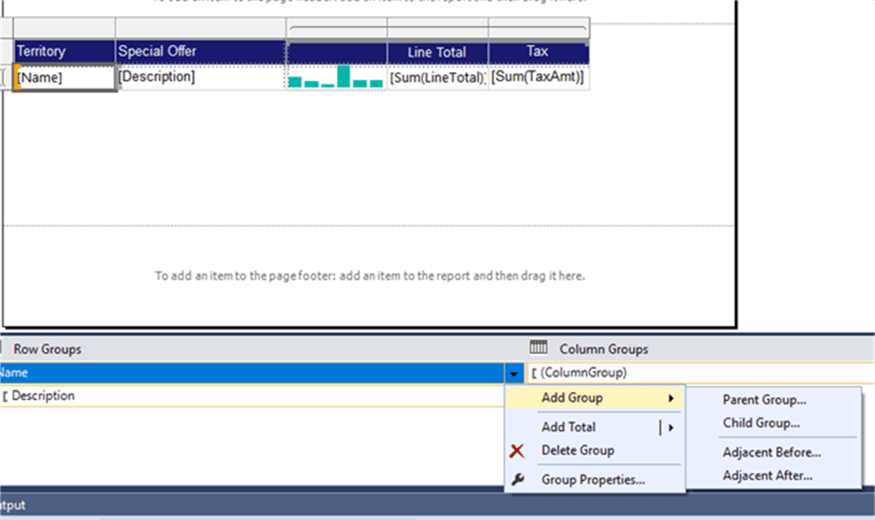
Just as we use Group By to appropriately aggregate and cluster data sets in T-SQL, SSRS uses row and column groups to accomplish the same task. Certainly, you will hear database purest sometime say these tasks should be handled by the presentation layer, where as SSRS certainly qualifies as such a presentation tool. SSRS contains two main aggregation methods, one for rows and one for columns. Column groups are most often used with a matrix, whereas row groups are used for table objects, in additional to matrix objects. As illustrated next, a group can be added by either selecting a cell and then Insert Row (or Column) or by selecting the down arrow next to an existing group and selecting Add Group. In both cases, a parent, group higher in the hierarchy, or child group, a group lower in the hierarchy, can be added. Moreover, instead of a parent or child group, an adjacent, but not part of the existing group can supplement the current group. Adjacent groups create a non-related grouping outside the existing group which is convenient for showing two distinct groups within the bounds of the same report.
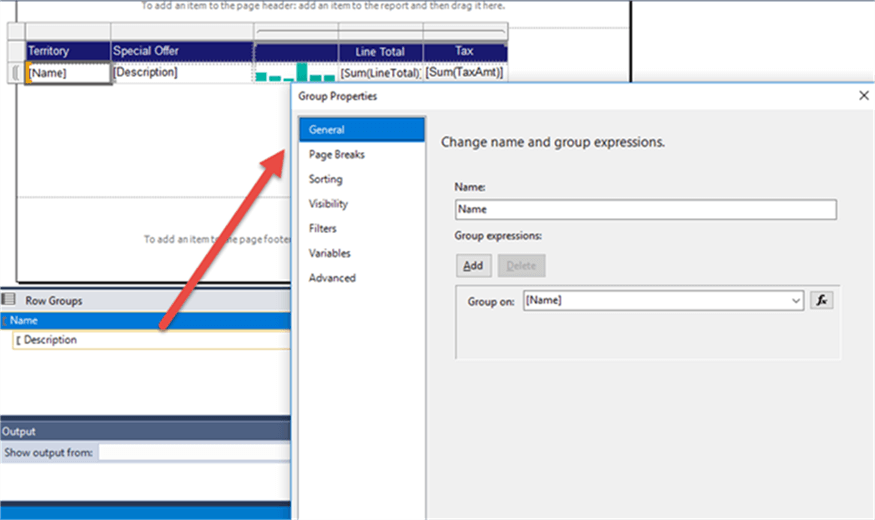
For each row or column group, the name and group by items are set on the main screen. As shown below, the group can be a compound group if needed; a compound group is one that uses more than a single data values to make up the grouping. In addition to the group by field, the group can be sorted, the visibility set to hide or show, page breaks inserted between groups, and filters applied against the group as needed.
Formatting and other Properties
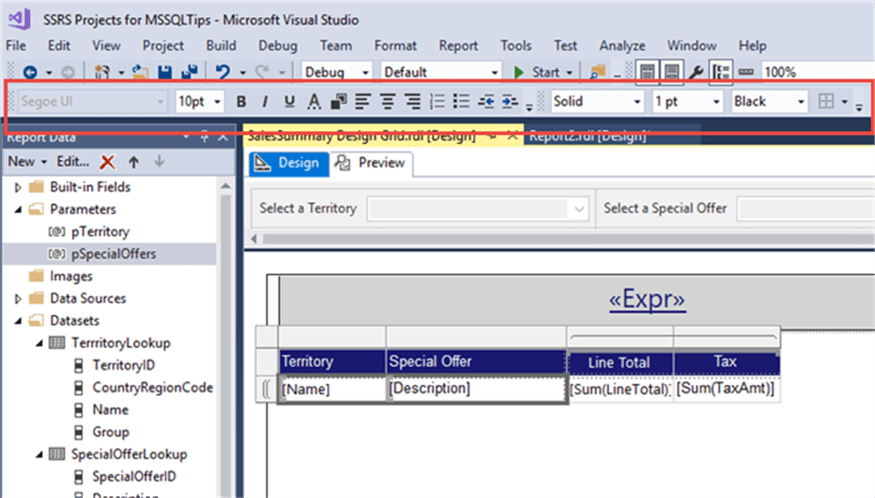
A report without formatting is a what I would call boring and hard to read. Proper formats enhance the value and readability of a report. Many of the basic formatting items, such as font, font size, alignment, bold, underline, italics, and borders, are available within the toolbar. In a fashion like Excel, you can often select multiple cells and format them all in “one click”. This multi-select option works generally if the all the cells are already using the same original fonts.
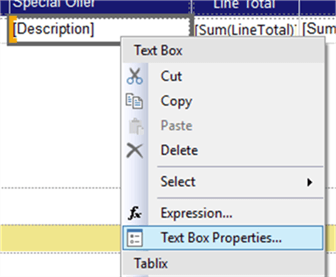
In addition to the toolbar option, you also can adjust several of the formatting properties by selecting the text box, right clicking, and selecting text box properties (note, this option only works for a single cell).
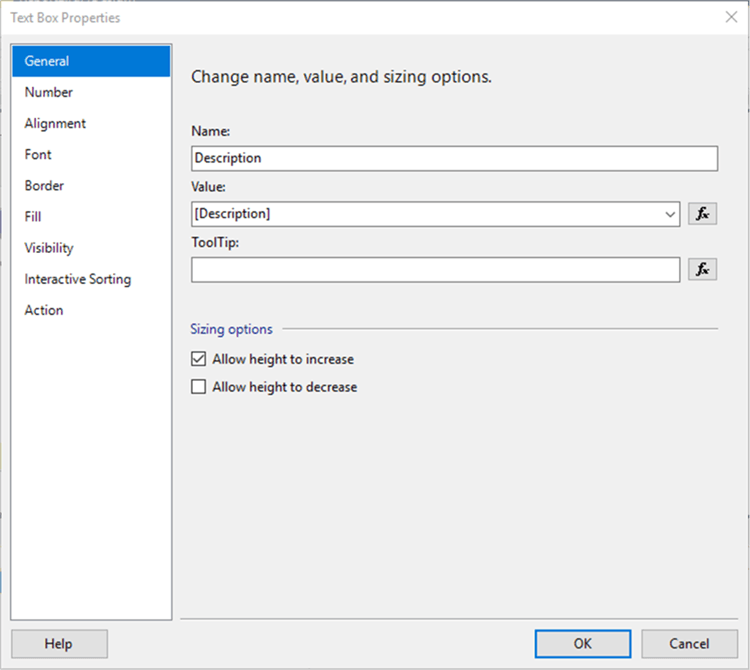
From here, just as with the toolbar, the alignment, font, border, and fill properties can all be set. However, one very handy property, is the allow height to increase (aka CanGrow property) and the allow height to decrease (aka CanShrink property); these properties allow / prevent the cell from growing larger or shrinking based on the data contained in the textbox. If a report has fixed heights and widths, it is a good idea to set these properties properly (although some data may get cut off).
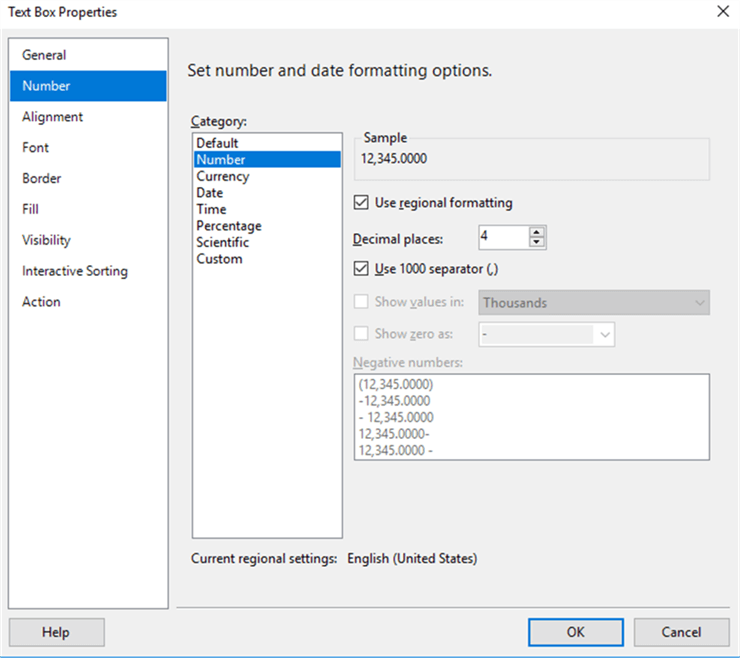
One other common change is to adjust the data type being used to format the values within the text box based on the general formatting options, such as date, time, currency, percent, numeric, etc.
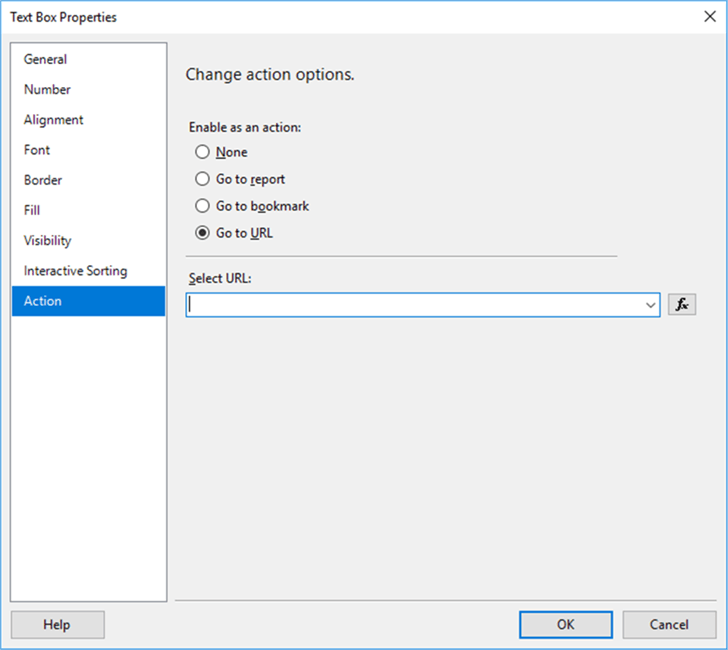
The action option provides a way to insert a link to another part of the report, another report, or even to a URL. This functionality could easily be used, for instance in the case of a postal code, to add a URL link which navigates to Google or Bing maps using the listed zip code.
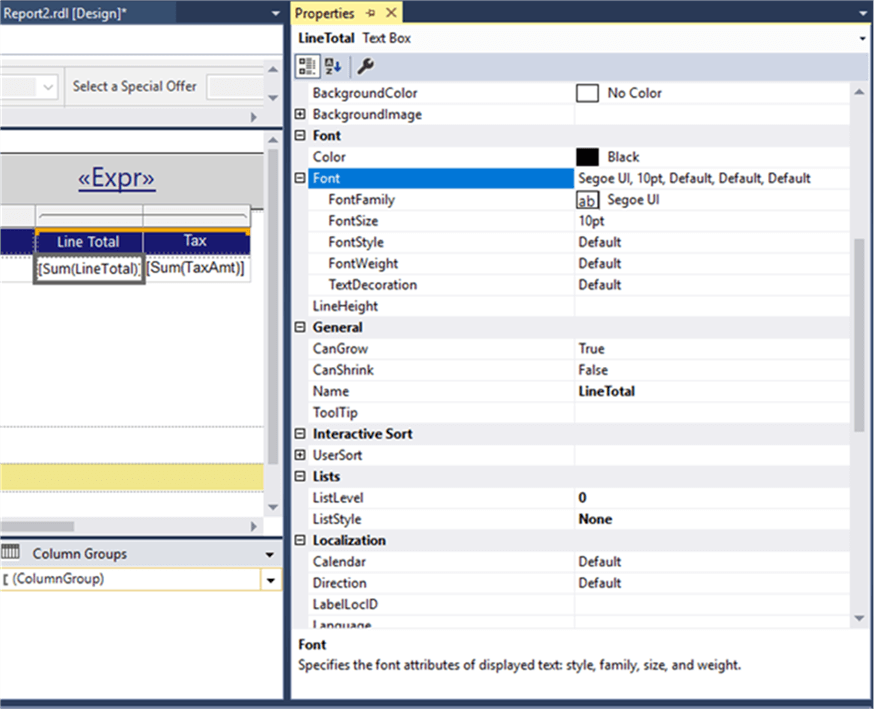
Outside of using the various toolbars and properties window, the “raw” values for each of the cell properties can be set directly using the properties pane. As illustrated below, each of properties can be adjusted within the pane itself. Most of the properties can be input straight into the related box or the values can often be selected from a list. This pane is a quick way to set many properties at once.
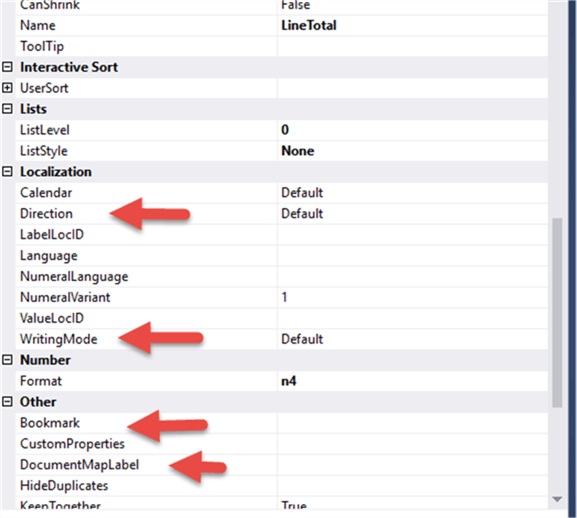
I would like to highlight several other properties that can be useful in report design:
- Direction – allow for the writing to be set from right to left instead of left to right.
- WritingMode – allows for the text to be written horizontal, vertical, or rotated.
- Bookmark – inserts a bookmark in the report that report consumers can use as a “jump to”.
- DocumentMapLabel- similar to a bookmark but is at the object level. This property allows report consumers to jump to a particular object in the report, but shows on the left side of the report itself and is passed to several of the exported reports (PDF, Excel). This option is very handy on long reports.
Paging and Page Breaks
Paging within SSRS can be a challenge, especially when dealing with multiple levels of paging. SSRS determines automatically the location of page break based on the size of the report. The basic size of the report, including all headers and footers, is set under Report > Report Properties. It is on this window that the overall page size is set along with the size of the margins. The Paper size option includes several preset sizes.
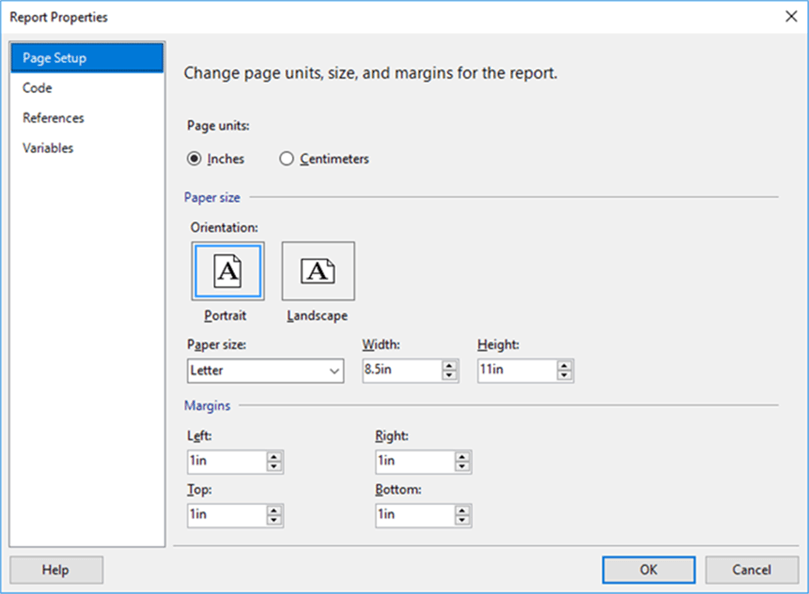
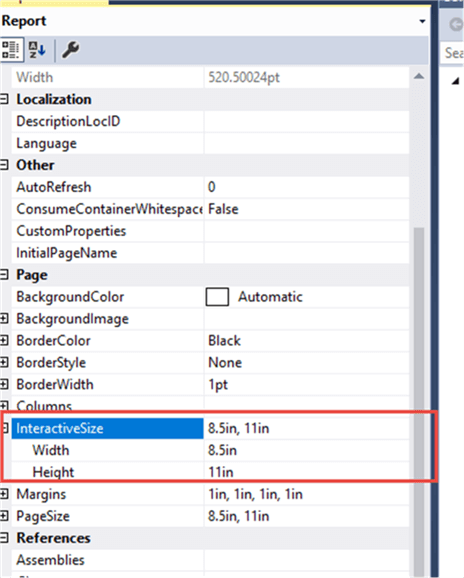
In addition to the normal page size, SSRS includes an option to set the interactive page size. These properties set the size of the page when viewing on the SSRS website.
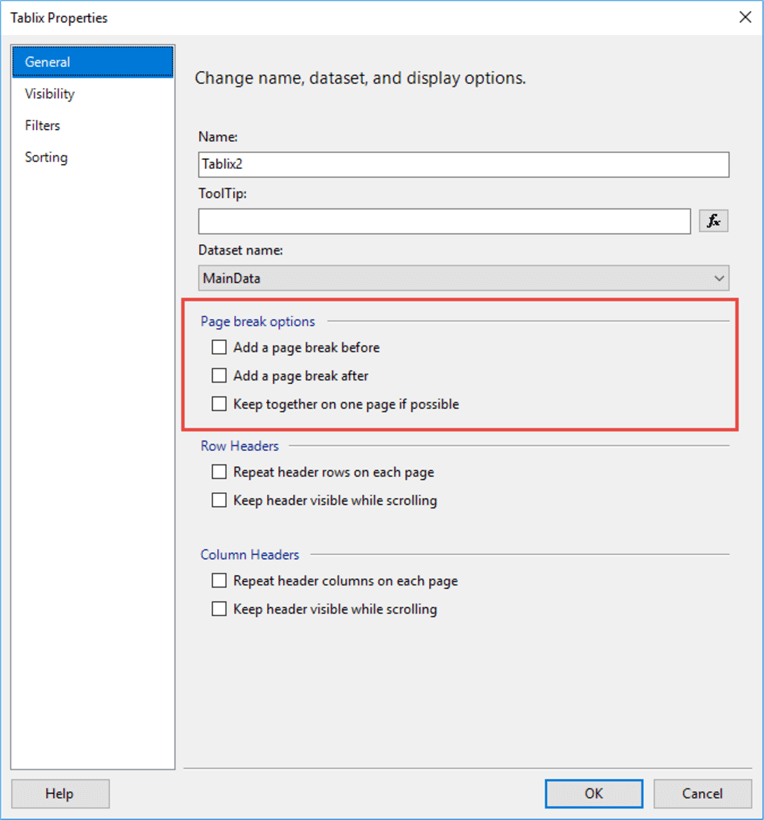
Once the page size is set, the next option to control is location of the page breaks. As mentioned previously, SSRS will insert page breaks where it sees fit, but we can also force page breaks between objects. As shown below for a matrix, a page break can be added before or after an object; similar options exist for many other of the objects. We can also request that SSRS “try” to keep data together on one page.
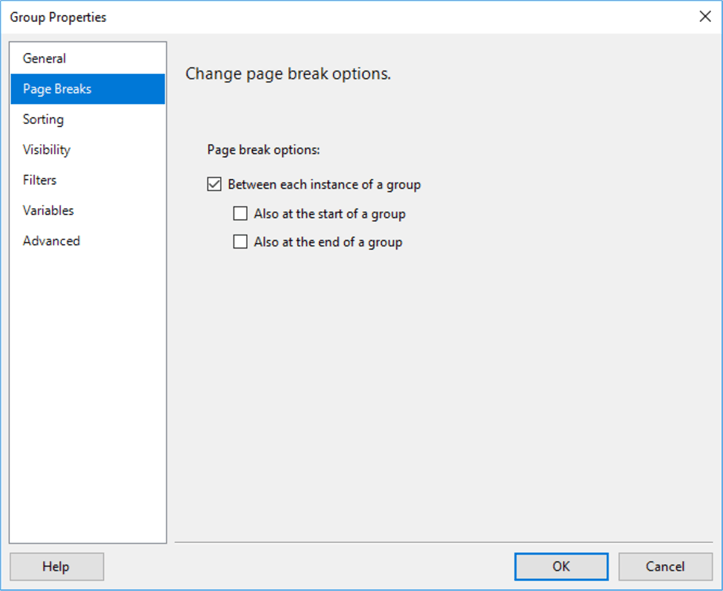
In addition to the object level, page breaks can also be inserted between values within a group.
Furthermore, one handy option to keep multiple objects together on a single page is use a rectangle. The rectangle serves as a container within which multiple objects can be placed. The rectangle then attempts to keep everything within its bounds on the single page.
Paging can get very complicated very quickly; this tip may assist with dealing with some of those paging challenges.
Images
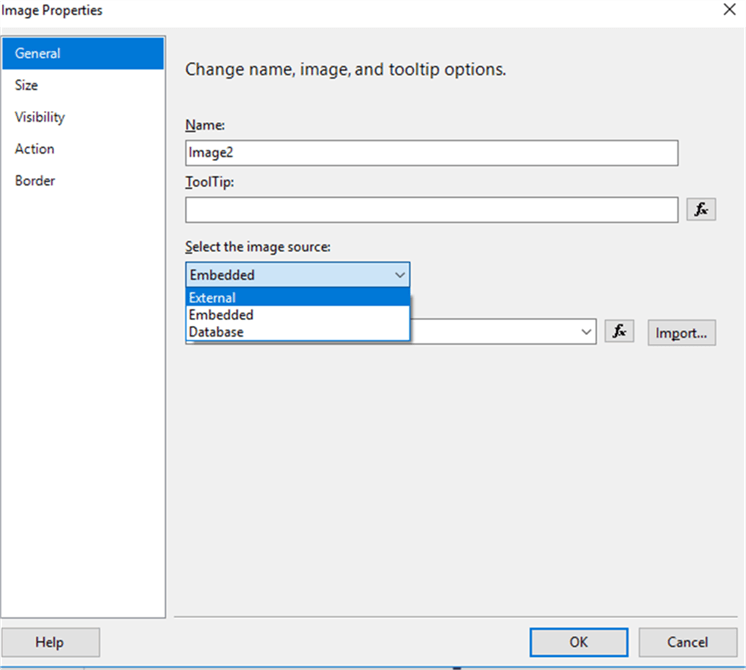
Adding an image to the design grid is as simple as dragging the image object onto the design grid. However, once on the design window, you have the option to select the image source from three choices:
- External – a URL is used to point to the image location. Note that SSRS must have access to this location.
- Embedded – image is loaded into this individual report.
- Database – the image is retrieved from a binary in the database.
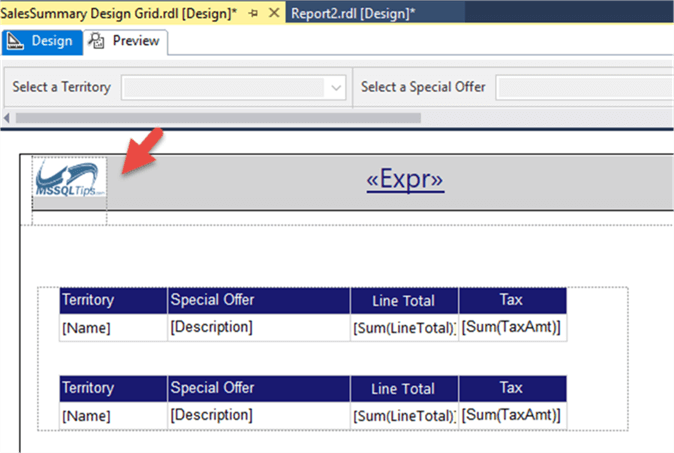
Using the external option, I pointed to the MSSQLTips Logo on the MSQLTips.com website.
ReportItems
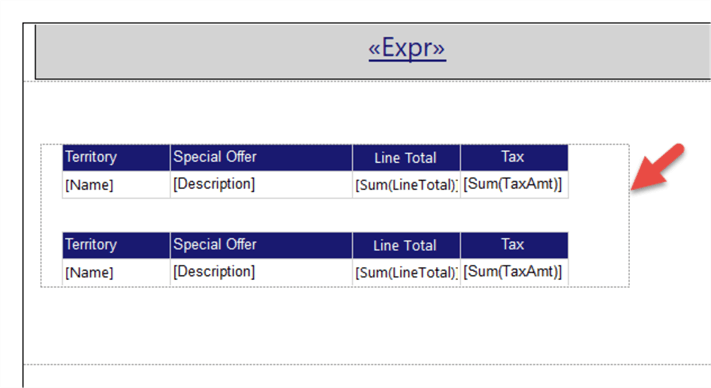
ReportItems is a collection function that allows a report designer to reference a textbox somewhere else on the report. The ReportItems field can be placed on the report header or report footer. It is just a pointer to another textbox on the report.
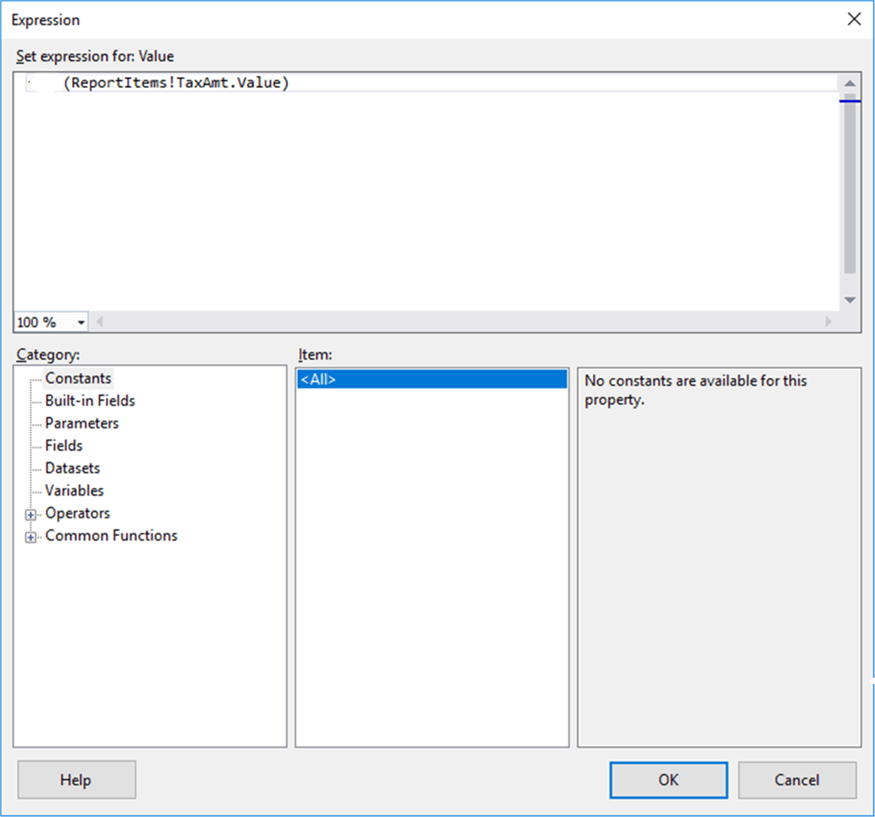
The process of using a ReportItems collection requires that you use the following format: ReportItems!TextboxName.Value; TextboxName would be replaced with the actual name of the textbox being referenced. Thus, in the below example the TaxAmt text box is being referenced.
The dilemma, though, is that text box will be represented by one cell for each line that is produced by the data; if a cell is tied to a row group it will have as many lines as the number of group values. Thus, SSRS will use the “last row” in the list. That result may be desired, but normally is not what is being requested.
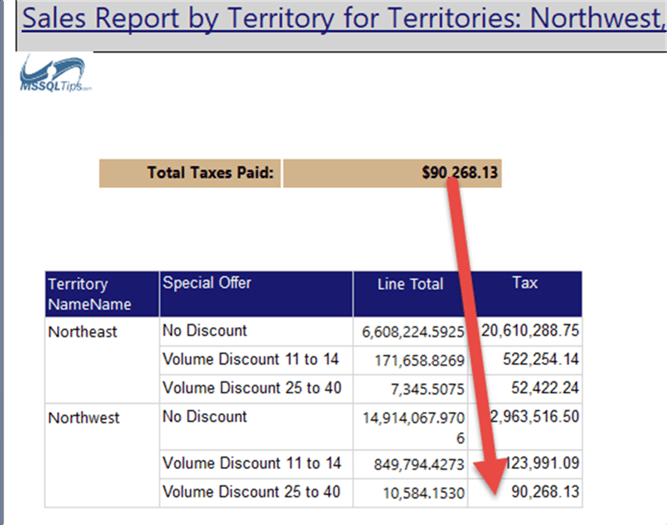
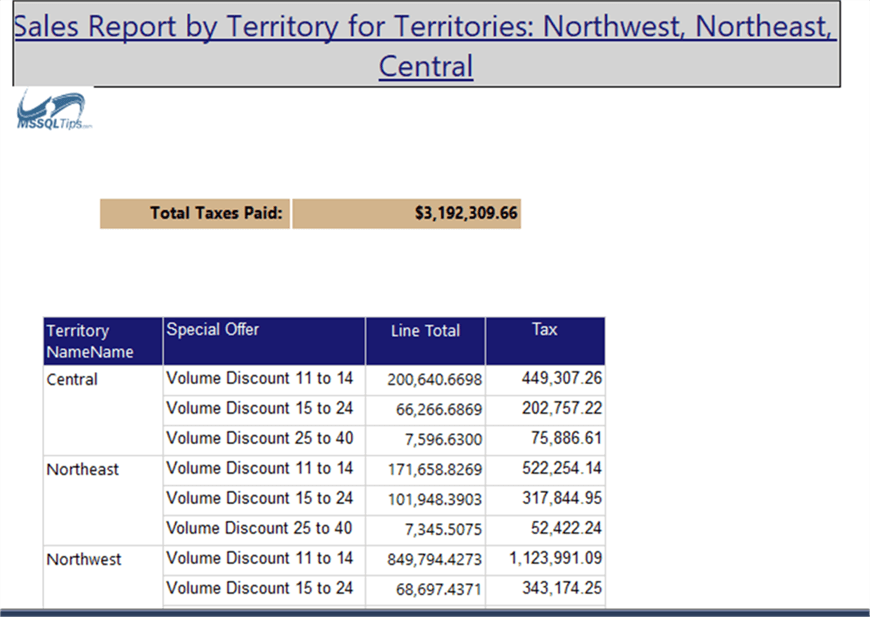
Instead, often we will use an aggregate such as Sum or Max to get the sum or maximum value (highest sales value for instance).
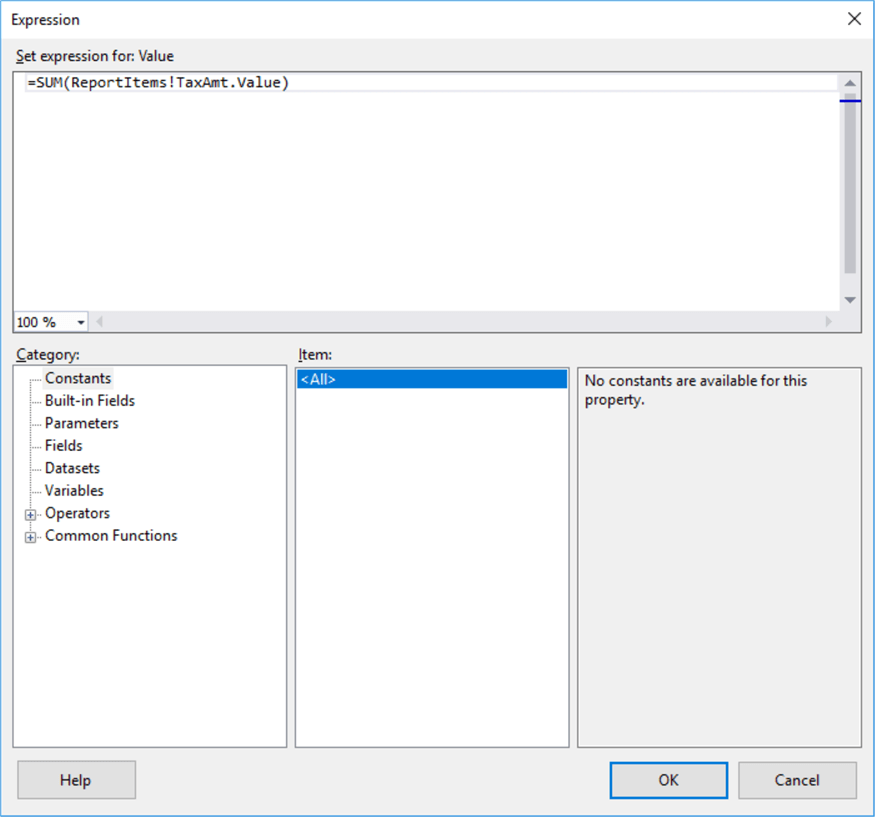
The Sum function gives us a better result.
Check out more examples of using the ReportItems collection.
Now that we have a basic report finished, our next tutorial will review the various deployment options available for a report.
