By: Greg Robidoux | Comments (4) | Related: > Performance Tuning
Problem
Just about all SQL Server performance related tips talk about using data from Performance Monitor and data from SQL Profiler. The big draw back has always been that they are two totally separate tools, with different interfaces and therefore you need to figure out a way to correlate the data between the two applications on your own. This was the old way of doing things, but with SQL Server Profiler for SQL 2005 and later this has changed.
Solution
The version of SQL Server Profiler that comes with SQL Server 2005 and later allows you to load both performance counter data and trace data.
The first thing you need to do is collect performance data and trace data. This can be done either manually or by using an automated approach such as was shown in this tip Collecting Performance Statistics for Scheduled Jobs and this tip SQL Server Performance Statistics Using a Server Side Trace.
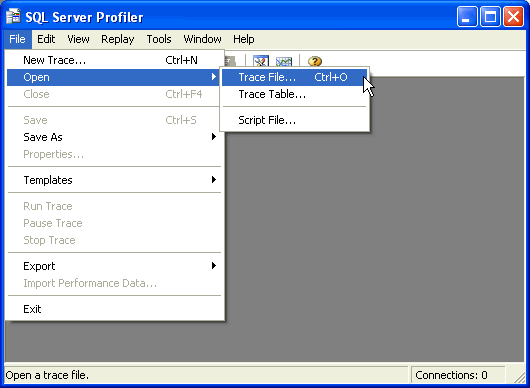
Once you have the data collected you need to launch SQL Server Profiler and load your trace file.

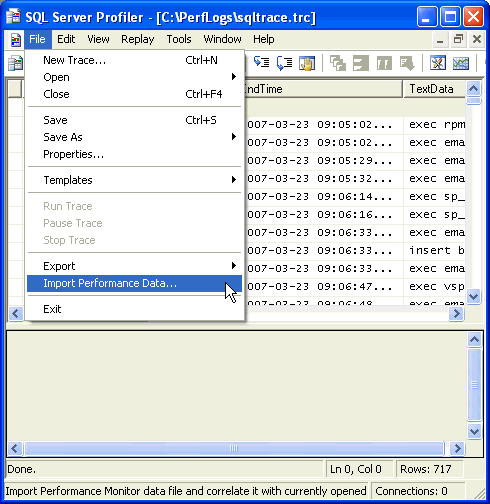
After you load your trace file you need to import your performance data.

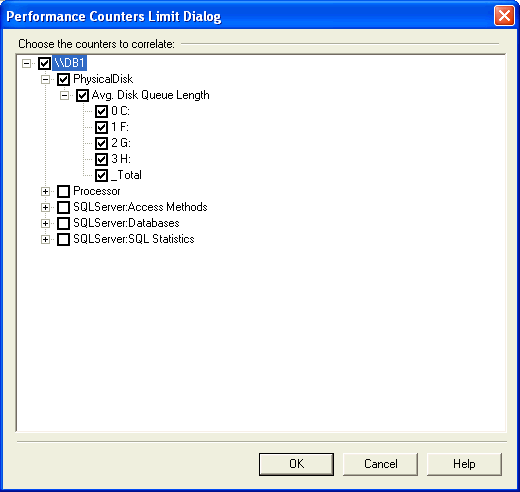
After you load the trace data, you now need to select the performance counters you want to see along with the trace data. Don't be tempted to select everything, because the performance metric graphs will be hard to read.

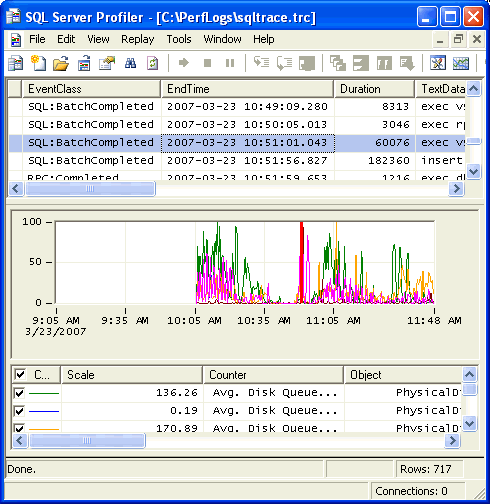
As you navigate through the trace data or the performance data the corresponding data will also be shown. The following screen shows you the corresponding SQL statement along with the performance counters during that time frame.

As you can see this is pretty easy and also can give you added insight by looking at both sets of data at the same time. The only thing to keep in mind is that you need to make sure you collect the StartTime and EndTime in the trace file, so this tool can correlate the times when displaying the data.
Next Steps
- Take a look at these other performance related tips
About the author
 Greg Robidoux is the President and founder of Edgewood Solutions, a technology services company delivering services and solutions for Microsoft SQL Server. He is also one of the co-founders of MSSQLTips.com. Greg has been working with SQL Server since 1999, has authored numerous database-related articles, and delivered several presentations related to SQL Server. Before SQL Server, he worked on many data platforms such as DB2, Oracle, Sybase, and Informix.
This author pledges the content of this article is based on professional experience and not AI generated.
View all my tips


