By: Jeremy Kadlec | Updated: 2023-05-03 | Comments | Related: > Performance Tuning
Problem
Our database environment constantly grows – the number of database instances, supported platforms, and cloud servers. It's all due to organizational growth, which stretches the database team tam with the increased demands and expectations of the business. To manage this growth, our team size has also increased, but our new members have varying skill sets and levels of expertise.
Unfortunately, managing the database environment growth has been challenging while onboarding new team members. At this point, we have been writing custom scripts per database platform, which is time-consuming and does not give us a complete picture of the environment. We need a comprehensive solution for our database environment to stay ahead of the growth curve and enable new opportunities for our organization.
Solution
Simultaneously managing a rapidly growing database environment and growing the team is extremely challenging. Allocating custom script builds for each database platform/ version in conjunction with siloed tools from database vendors make it difficult to understand performance across the environment, never mind prioritizing those issues. Further, the team spends significant time writing and modifying code, then collecting and analyzing performance data. Without the proper tools, we have no insight into the environment, so we lose control of overall performance and management of that performance. The team spends most of their time delivering on applications, which results in constant firefighting in the database layer rather than planning, testing, implementing, and managing the environment.
The solution to improve your team's efficiency to scale your business grows is SolarWinds Database Insights, which combines two enterprise-ready products: Database Performance Analyzer (DPA) and SQL Sentry. Database Performance Analyzer (DPA) is a multi-platform (SQL Server, Oracle, DB2, Azure, AWS, Postgres, etc.) analysis and performance tuning tool based on wait time analysis. SQL Sentry is a performance and monitoring tool for deep root cause analysis for the Microsoft SQL Server Data Platform, Availability Groups, SQL Server Analysis Services (SSAS), and Azure Synapse Analytics. SolarWinds Database Insights provides the depth and breadth to help Database Administrators (DBAs) with the following:
- Continuous insight into health and performance across hundreds or thousands of instances that have never been visualized before
- Wait Time Analysis for a continuous means to analyze database performance with granular data
- Recommendations to correct database design and coding issues yielding significant time savings
- Anomaly Detection based on Machine Learning and AI to recognize performance outside the norm
- Visualize poorly performing code with supporting metrics to prioritize issues
- Valuable recommendations to correct problematic code (stored procedures, subqueries, WHERE clause, etc.) and indexes in the database to increase productivity
- Intuitive and exploratory interface to dissect performance issues against numerous database platforms, VMware, and operating systems to share with Developers, Admins, QA, and Management without compromising production security
- Less than 1% load on the monitored servers based on the agentless architecture requiring minimal configuration
Let's discover how SolarWinds Database Insights can help Database Administrators and Developers.
Environment Overview, Health Checks, and Alerting
With SolarWinds DPA, you have eyes across your entire database environment that uncovers the most critical issues based on continuous, low-impact data collection.
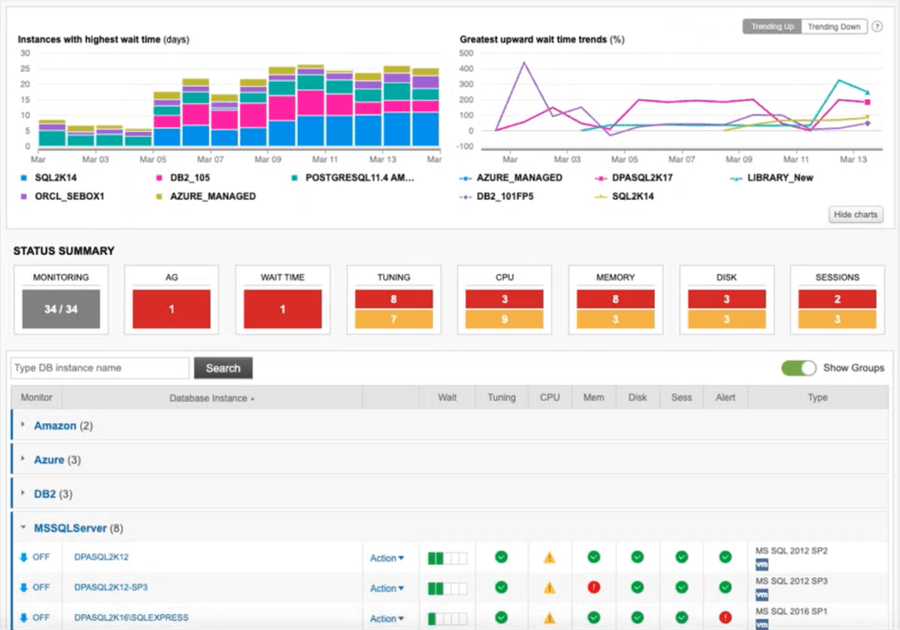
DPA provides a holistic view of multiple database platforms on-premises and in the cloud, summarized in a single interface. Your database team can recognize issues across the database environment regarding the highest wait time per day, most significant upward time trends, and alerts and warnings.
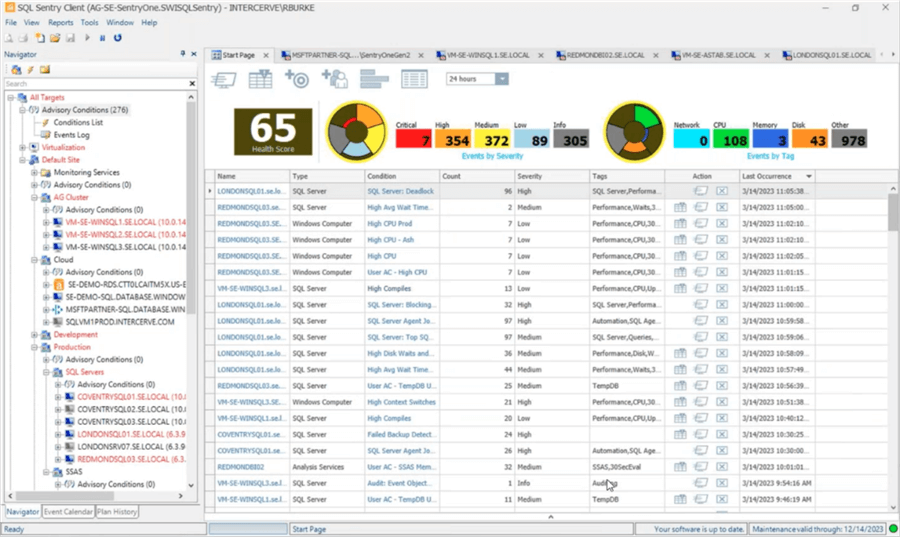
SQL Sentry also offers a web-based and desktop application for understanding the SQL Server performance in your environment with a summarized Health Score, Events by Severity (Critical to Informational), and Events by Tag (Network, CPU, Memory, Disk, etc.). In this dashboard, servers can be organized based on location or environment, such as Production, Development, Cloud, Always On, etc.
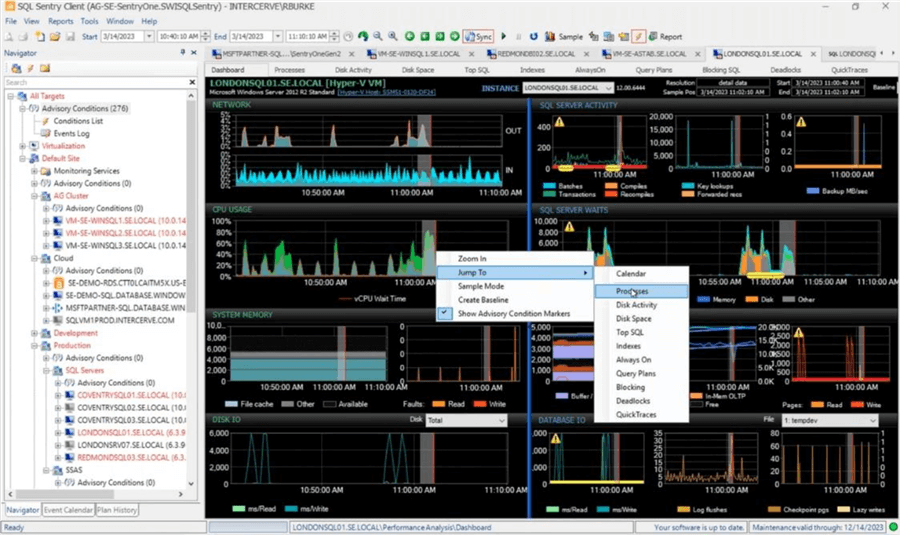
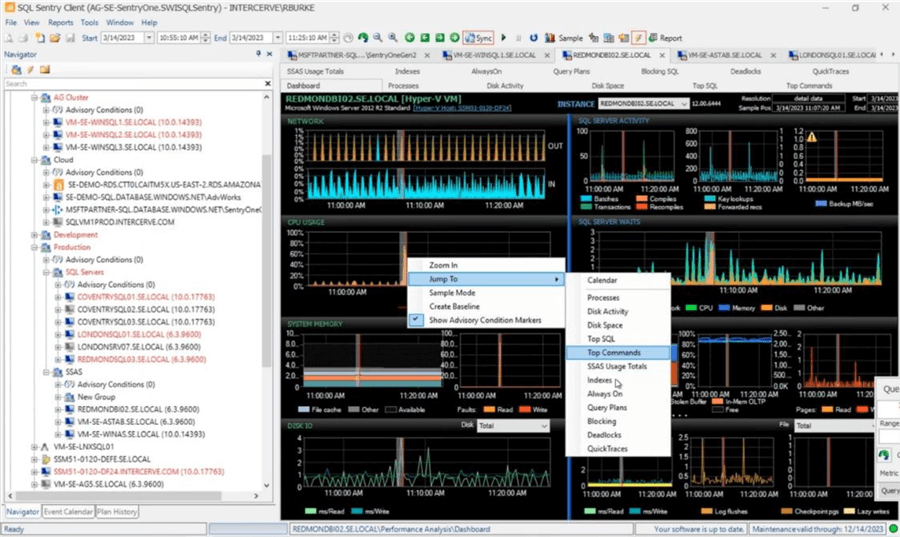
From the SQL Sentry dashboard, you can drill into a specific server to SQL Server, Windows, Hyper-V, etc., metrics, as shown in the following image. The dashboard provides the ability to highlight a metric and see the corresponding performance data across each chart. From there, you can drill down further into Processes, Disk Activity, Disk Space, Top SQL, Indexes, Always On, Query Plans, Blocking, Deadlocks, and Quick Traces.
SolarWinds provides intuitive and exploratory interfaces to quickly determine performance issues supported by historical data to understand performance during a particular time frame. These applications enable your team to easily assess performance issues and allocate team members' time based on the most significant need.
Tuning Advisors in SolarWinds DPA - Query, Table, and Index
SolarWinds DPA makes you the proactive DBA in your organization with the ability to solve performance problems before they impact the user experience. The Query, Table, and Index Tuning Advisors features are a by-product of the vast amount of data that DPA is already collecting, and can guide you in your mission to fix poorly performing workloads.
DPA's Table Tuning Advisors can help with the following:
- Identify the most inefficient queries for the table.
- Correlate issues at the table level that impact numerous queries.
- Determine missing indexes.
- Uncover queries with many reads and a low percentage of data returned, which could be an issue with conditions in the WHERE clause.
- Focus on the predicates in the WHERE clause to determine patterns and inefficiencies.
- Highlight out-of-date statistics.
- Detect the percentage of insert, update, and delete transactions referred to as "churn".
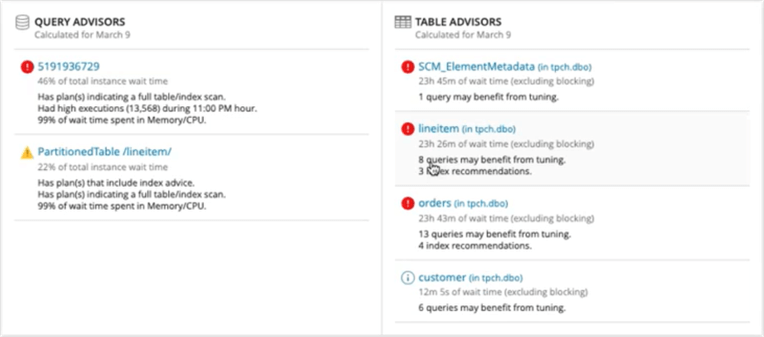
Below is a summary for the Query and Table Advisors, where you can see table scanning, high wait statistics, and index recommendations
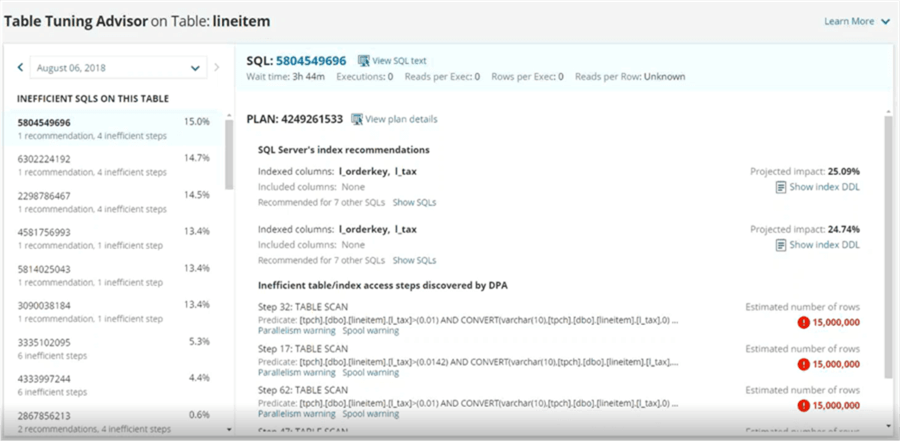
In this example, we click on the LineItem recommendations and see a prioritized list of the inefficient SQL statements on the left, with the details per-statement on the right. With this table, a single query plan is table scanning multiple times at steps 32, 17, and 62 and would benefit from an index on the l_orderkey and l_tax columns. We can also see seven additional SQL statements that would be improved with the same index. By analyzing the workload at the table level, parsing the query plans, and breaking down the inefficient steps to justify the recommendations, we can create one set of indexes to correct numerous queries yielding improvements across multiple applications and processes. In this example, the Projected Impact of the new index is a 25 percent improvement.
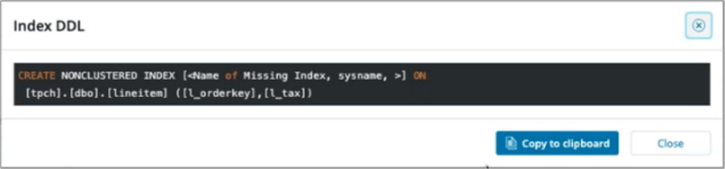
DPA also generates the CREATE INDEX statement so you can quickly begin validating the recommendation, which streamlines the path to improve performance and the user experience.
Blocking and Deadlocks in SQL Sentry
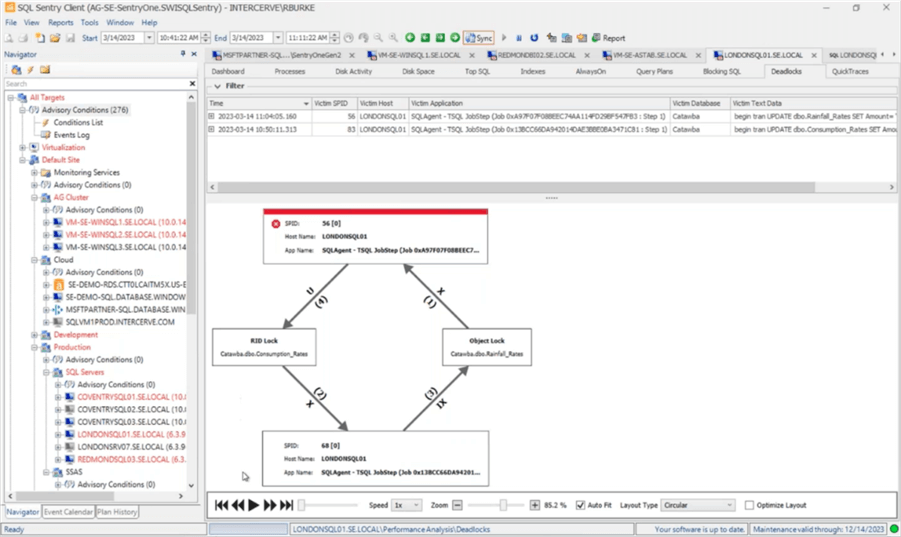
Blocking and deadlocks can be an absolute performance nightmare. Collecting and understanding the pertinent data to resolve these transient yet significant issues is imperative. SQL Sentry includes the collection of the blocking and deadlock data then provides a means to replay the incident to understand the impacts between objects to resolve these issues.
Anomaly Detection in SolarWinds Database Performance Analyzer
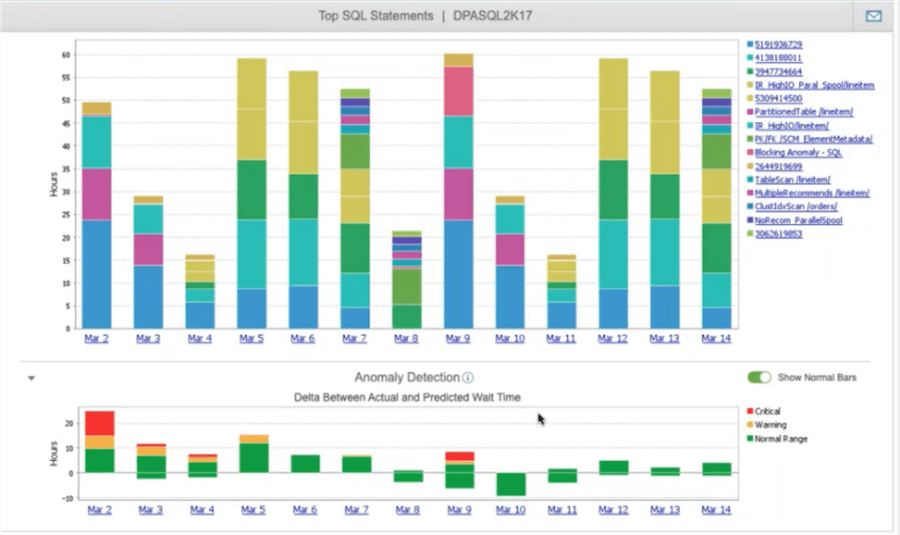
The SolarWinds DPA database performance view is split into three sections–Top SQL Statements, Anomaly Detection, and tabbed data. There is a tremendous amount of correlated information on a single interface with the ability to drill into code and get valuable recommendations. Let's check it out.
The first section, Top SQL Statements, is color-coded to understand patterns over a two-week period. When you hover your mouse over a bar, the performance metrics for that code are displayed. The Query Hashes are also displayed on the top right of this section which can be used to prioritize database-level issues and drill into the code to begin troubleshooting.
The second section of the interface uses Anomaly Detection to determine if the actual performance deviates from the expected performance based on historical data. The red (critical) and orange (warning) portions of the graph indicate anomalous time periods. This chart helps determine whether reports from your user community related to poor performance are accurate.
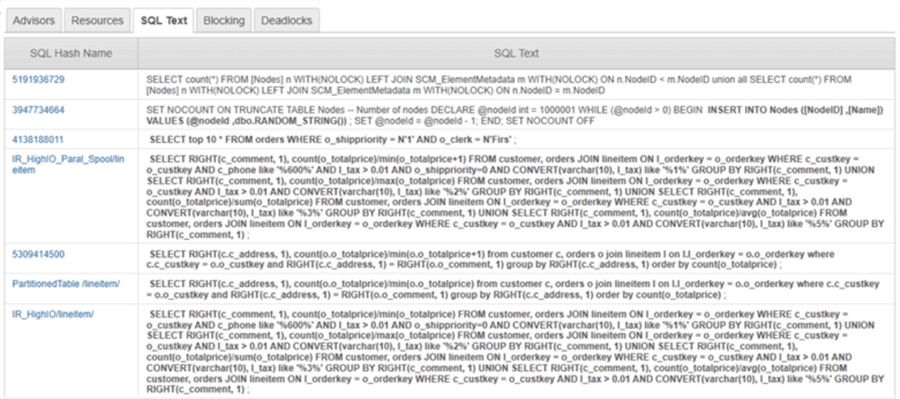
The third section of the interface includes five tabs for Advisors, Resources, SQL Text, Blocking, and Deadlocks. These are key areas to begin troubleshooting many performance issues. The benefit of this section is the data consolidation, correlation, and exploratory options to rapidly diagnose performance problems resulting in time savings.
Baselines in SQL Sentry
Beyond Anomaly Detection, Baselines are another approach to visualize database performance based on historical data to determine if the performance is in-range, higher, or lower than expected for a specific time frame. SQL Sentry includes Baselines to compare database, VMware, and operating system performance across all performance charts at a server level.
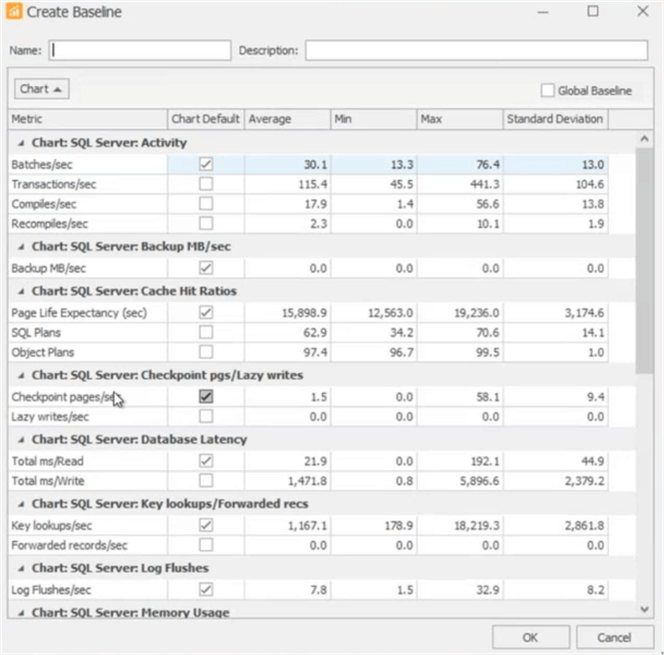
The first step is configuring the baseline across more than a dozen categories of SQL Sentry charts with the Average, Min, Max, and Standard Deviation specified for each counter. Once configured, you can enable and visualize the baseline on each chart.
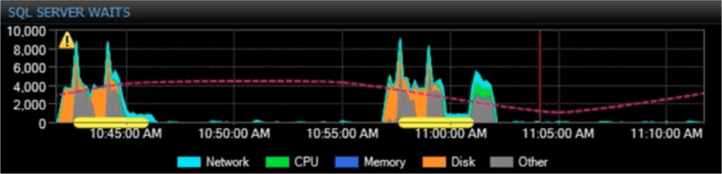
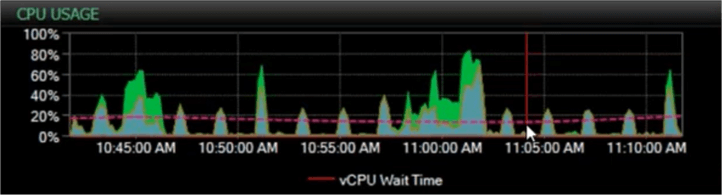
Below are two example SQL Sentry charts with the baseline enabled as a dotted purple line. This visualizes how the actual performance of SQL Server Wait and vCPU Wait Time compares to actual performance over 30 minutes. With baseline enabled, you can begin drilling into portions of the database workload that exceed the expected performance, then determine if this is a one-time issue or if you need to tune the corresponding code.
SQL Sentry Index Analysis
SQL Server indexes can make or break your performance. Too many indexes create unnecessary overhead and potential page splits in the database engine; Too few indexes cause SQL Server to table scan, index scan, perform row lookups, and more. Further, indexes require maintenance to function optimally because fragmentation can cause unnecessary page reads, thus degrading performance.
SQL Sentry recognizes these items and includes the Indexes tab for each SQL Server instance where the following metrics are included:
- Total Fragmentation
- Total Space Usage
- Total Buffer Usage
- Index Properties – Type (Clustered, Non Clustered, or Heap), Primary Key, Unique Key, File Group, Size, Row Count, Fragmentation, Fill Factor, Usage, and more
- Index Fragmentation
- Index Space Usage
- Index Activity
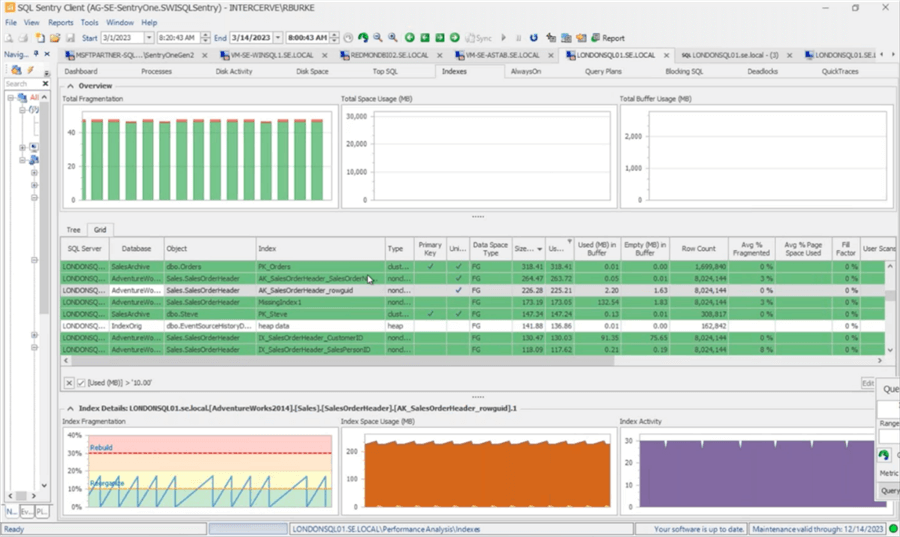
The SQL Sentry Index Tab provides significant time savings to SQL Server professionals by identifying:
- Indexes that are fragmented and require a reorganization or rebuild to help improve data access.
- Unused indexes that use unnecessary disk space and generate additional overhead for the database engine to manage.
- Tables without indexes, known as Heaps, may benefit from Clustered and/or Non Clustered indexes based on the workload.
SQL Sentry's Disk Activity and Storage Prediction
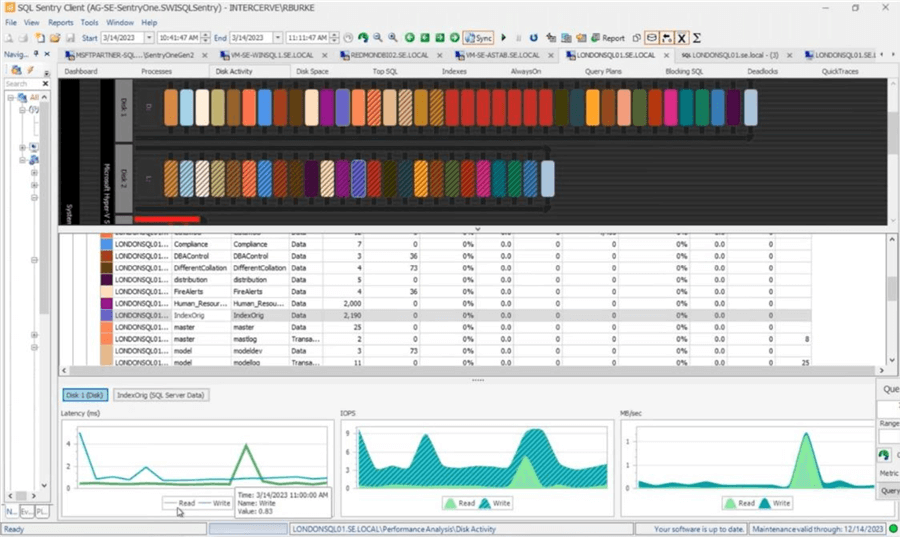
Storage is often a major culprit of poor database performance. Generally, as DBAs, we have easy access to general CPU, Memory, and Disk usage, but digging into the details is always challenging. When various storage devices are in the equation, the complexities grow exponentially. Often, DBAs do not have access to underlying storage tools, which makes visualizing the storage system and trouble-shooting performance challenging. This is where SQL Sentry helps immensely. When troubleshooting a specific database instance, you can navigate to the Disk Activity tab to access information about storage supporting your database instance. SQL Sentry breaks your storage down by disk, LUN, database, and file type (database or transaction log) with metrics and charts on Latency, IOPS, and MB/sec for Read and Write Transactions to understand the current and historical performance.
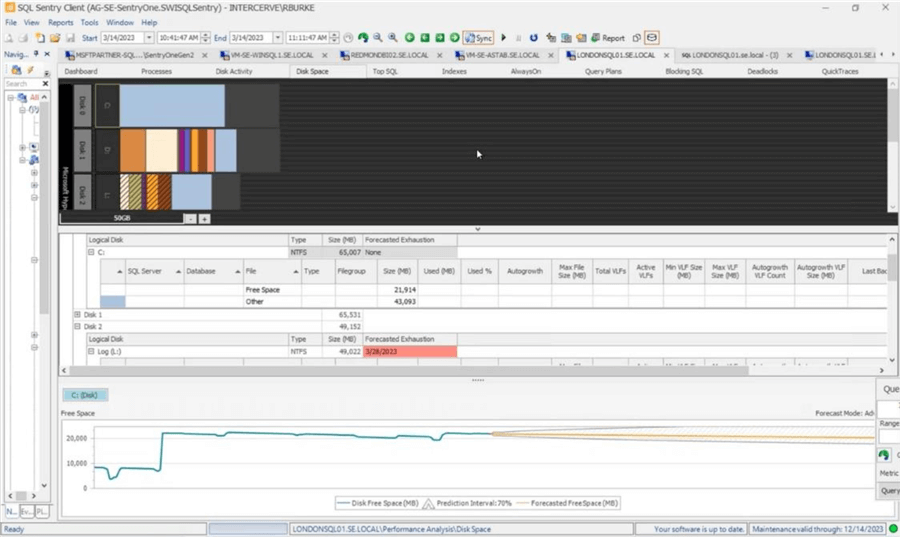
Beyond performance, another major storage concern for DBAs is disk space. SQL Sentry uses Machine Learning to forecast disk space based on historical growth rates then provides a date of when the storage is expected to be exhausted. This enables a proactive DBA to provision additional storage within the IT group and/or work with the organization to set up archiving rules or drop unused objects.
Insight into SSAS and Synapse Engines
For organizations that have adopted one of the Microsoft analytics engines - SQL Server Analysis Services (SSAS) or Azure Synapse Analytics - SQL Sentry delivers insight into these platforms.
For SSAS, both Tabular and Multidimensional databases are supported. On the main dashboard, there are four charts: SSAS Activity, SSAS General, SSAS Memory, and SSAS Storage. Further, Completed Queries are retained, capturing the top 20% highest performance MDX, DAX, DMX, and XLMA queries. SQL Sentry also includes performance statistics for Hierarchies, including Attributes, Aggregations, and Partitions.
For Azure Synapse Analytics, SQL Sentry delivers charts on the following:
- Data Movement caused by poorly designed queries or incorrectly distributed tables.
- Distributed Queries Performance.
- Metrics for Filtering, Sorting, and Grouping.
- Timing for data imports, backups, and restores.
- Alerting for overall system health, distributed query performance, data imports, and backup times.
- Event Calendar to visualize concurrent processes.
The screenshot below shows the SQL Sentry Data Movement tab with charts on Distribution Activity, Node Activity, Data Movement, Elapsed Time, Rows Processes, MB Processed, and MB / Sec.
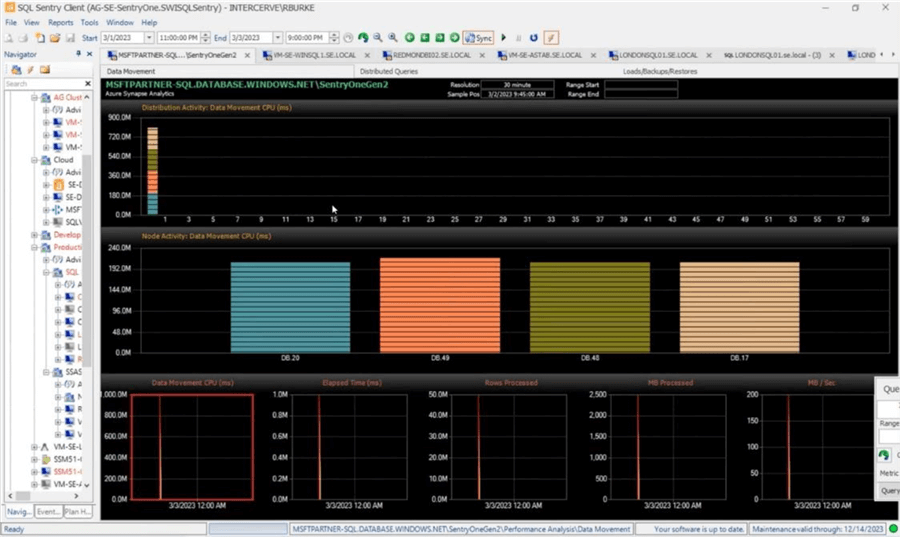
If your organization suffers from performance issues with SSAS or Azure Synapse Analytics, SQL Sentry can provide insight into the engine to help you prioritize and solve these issues.
How Do I Get Started with SolarWinds Database Insights?
- Think about the hours it takes to monitor, diagnose, validate, test, and
deploy database performance improvements across your environment.
- With the features in DPA and SQL Sentry, these tools prioritize and streamline the monitoring and performance tuning processes significantly to focus on core business initiatives.
- Put DPA and SQL Sentry through the paces in your environment by
downloading a free trial and see how quickly these tools help identify and
then help you correct performance problems in your production environments.
Consider using these tools in QA environments as well to understand your workload
before impacting the organization in production.
- Have a question as you evaluate the tools? Reach out directly to SolarWinds at 866.530.8100 or [email protected] to get your questions answered.
- Communicate to your management how DPA and SQL Sentry will help your team:
- Prioritize performance issues across the entire environment based on waits your systems are experiencing.
- View 30-day performance metrics to understand trending, problematic code, anomalies, etc.
- Justify the performance improvement with the proposed corrections to address the root cause issue.
- Plug and play code to streamline the performance improvements.
- No performance overhead with an agentless architecture for these new features, simple new algorithms to put the data in the hands of the DBA to make fast and informed decisions.
- Multi database platform support on-premises and in the cloud.
- After working with DPA and SQL Sentry, share the results with your team and determine your next steps to radically improve the performance of your database applications.
Next Steps
- Learn more about Database Insights and get your free evaluation version
- Additional Resources
MSSQLTips.com Product Spotlight sponsored by SolarWinds, makers of Database Insights.
About the author
 Jeremy Kadlec is a Co-Founder, Editor and Author at MSSQLTips.com with more than 300 contributions. He is also the CTO @ Edgewood Solutions and a six-time SQL Server MVP. Jeremy brings 20+ years of SQL Server DBA and Developer experience to the community after earning a bachelor's degree from SSU and master's from UMBC.
This author pledges the content of this article is based on professional experience and not AI generated.
View all my tips
Article Last Updated: 2023-05-03