By: Siddharth Mehta
Overview
Once the cube is deployed and ready to host queries from the data store, client applications can start querying the cube. One of the most user friendly client tools for business users to query a cube is Microsoft Excel. It has a built-in interface and components to support GUI based connection, querying and formatting of data sourced from a cube. Business users can use the familiar interface of Excel and create ad-hoc pivot table reports by querying the cube without any detailed knowledge about querying a multidimensional data source. We will connect to the cube we just created using Excel and develop a very simple report using the cube data.
Explanation
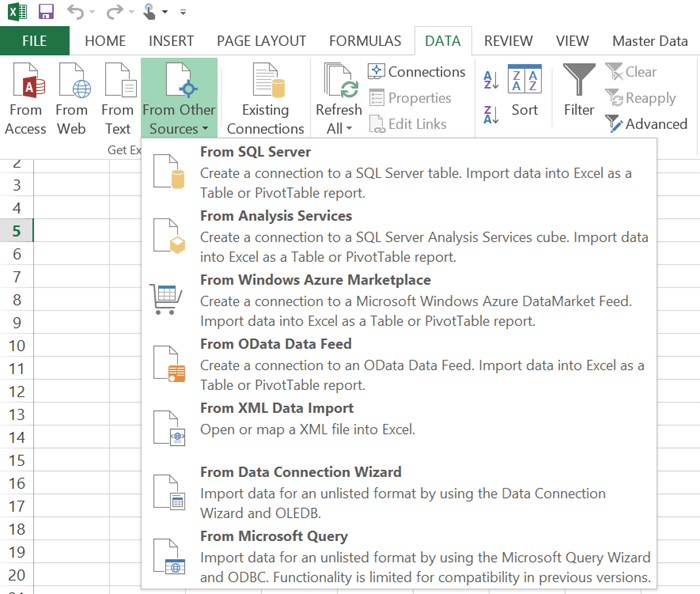
Open Microsoft Excel and select the “Data” tab from the menu ribbon. Click on “From Other Sources” and select “From Analysis Services” option as shown in the below screenshot.
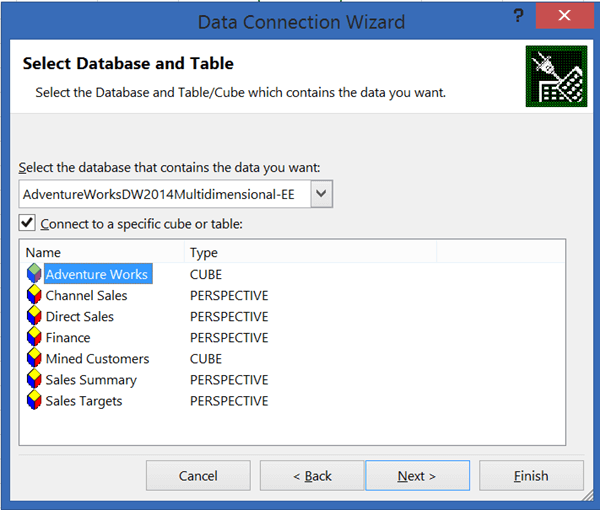
In the next step specify the SSAS server name and logon credentials. If you have all of the SSAS components installed on your local machine, you can also use “localhost” as the server name. If you were able to successfully connect to the specified SSAS instance with the logon credentials specified, in the next step you should be able to select the SSAS “AdventureWorks” database and find the Adventure Works Cube. Select the Adventure Works Cube and proceed to the next step.
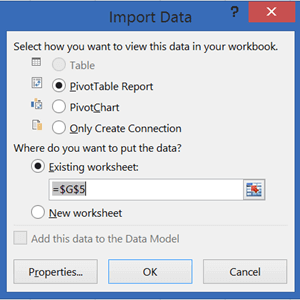
In the next step, specify the name of the connection file to save. This file will be saved as an .ODC file and you can reuse this connection file when you want to use the same connection in other workbooks. After saving the file, you will be prompted with the option to select the kind of report you want to create. We will go with the default option and select “PivotTable Report”.
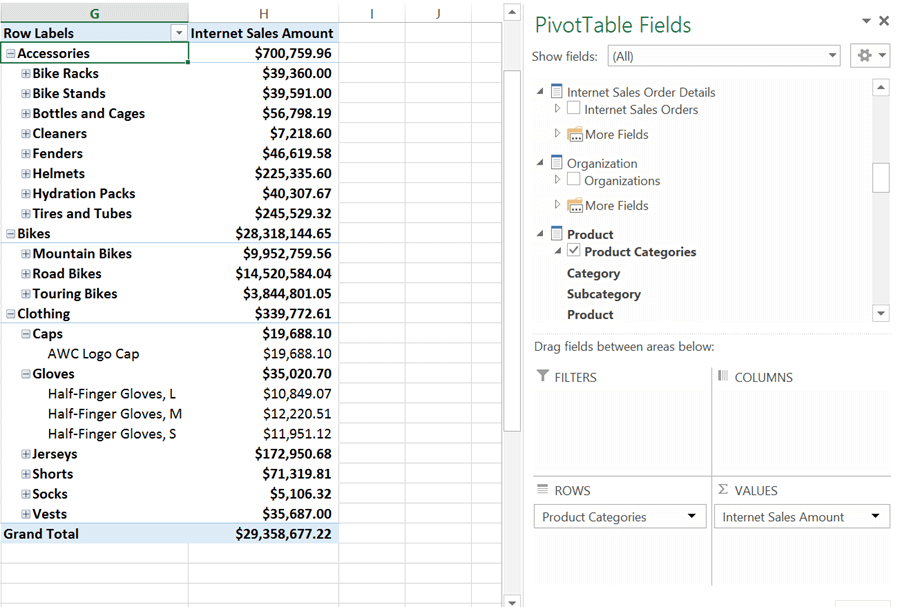
After selecting “PivotTable Report”, a designer will open with options to select dimension, attributes and measures to populate your pivot table. Select the values as shown in the below screenshot. We have selected Internet Sales Amount measure and Product Categories hierarchy from the Product dimension.
Additional Information
- Consider selecting more data elements from the cube, format the report and make it look more professional.
