By: Siddharth Mehta
Overview
Descriptive statistics is generally used for exploratory data analysis and to understand the shape and distribution of data. Different statistical coefficients are collected then categorized in terms of measures of central tendency, measures of association and measures of dispersion. We will look at the coefficients, formulas and their significance in the most simplified statistical terminology possible.
Measures of Central Tendency
In statistics, a central tendency is a central or typical value for a probability distribution. The most common measures of central tendency are the arithmetic mean, the median and the mode. A central tendency can be calculated either for a finite set of values or for a theoretical distribution, such as the normal distribution.
Mean
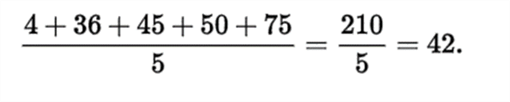
There are various types of means in mathematics like the Arithmetic Mean, the Geometric Mean, and the Harmonic Mean. We generally deal with the Arithmetic mean also termed as “Average”. Below is one example of arithmetic mean.
Mean is very sensitive to very small or large values in a dataset. Consider adding one more value to the below dataset, say the value 1000, and then calculate the mean and measure again to see how much it is skewed just by the addition of one more data point.
Median
The median is the value separating the higher half of a data sample, a population, or a probability distribution, from the lower half. For a data set, it may be thought of as the "middle" value. For example, in the data set {1, 3, 3, 6, 7, 8, 9}, the median is 6, the fourth largest, and also the fourth smallest, number in the sample. The basic advantage of the median in describing data compared to the mean is that it is not skewed so much by extremely large or small values, and so it may give a better idea of a typical value. For example, in understanding statistics like household income or assets, which vary greatly, a small number of extremely high or low values may skew a mean. Median income, for example, may be a better way to suggest what a 'typical' income is.
Mode
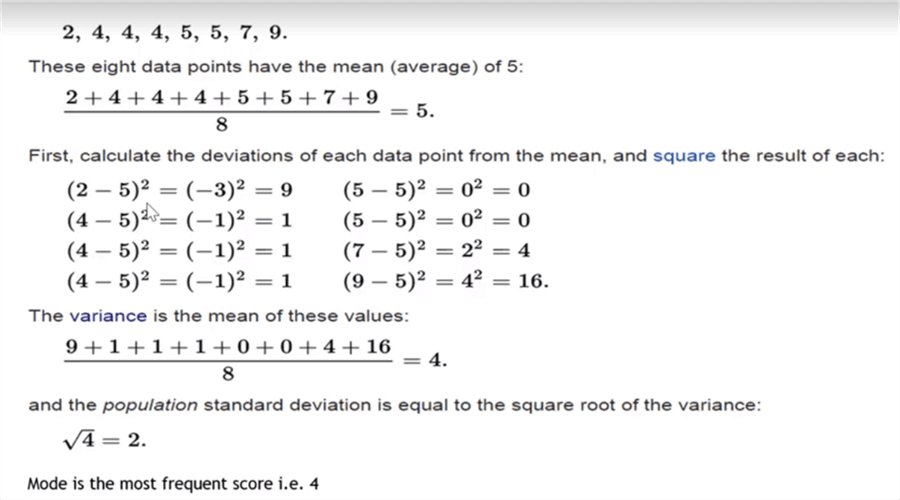
The mode of a set of data values is the value that appears most often. Like the statistical mean and median, the mode is a way of expressing, in a (usually) single number, important information about a random variable or a population. The numerical value of the mode is the same as that of the mean and median in a normal distribution and it may be very different in highly skewed distributions.
Measures of Dispersion
In statistics, dispersion (also called variability, scatter, or spread) is the extent to which a distribution is stretched or squeezed. Common examples of measures of statistical dispersion are the variance, standard deviation, and interquartile range.
Variance
In statistics, variance measures the spread of numbers from their average value. It is often termed as the square of standard deviation too. The formula to calculate the variance, without getting into statistical formulas, is shown below.
Standard Deviation
In statistics, the standard deviation (also represented by the Greek letter sigma ó) is a measure to quantify the amount of variation or dispersion of a set of data values. A low standard deviation indicates that the data points tend to be close to the mean (also called the expected value) of the set, while a high standard deviation indicates that the data points are spread out over a wider range of values. The standard deviation of a random variable, statistical population, data set, or probability distribution is the square root of its variance. The formula to calculate the variance without getting into statistical formulas is as shown below.
Range
This important statistic describes the measure of difference between the highest and lowest value in the dataset. Range is a very basic measure. Inter-quartile range is calculated by dividing data in quartiles. Inter-quartile range plays an important role in describing the data on a box-plot chart, which we will study in the next section. You can read more here.
Measures of Association
In statistics, any of various factors or coefficients used to quantify a relationship between two or more variables. Two of the most important measures of association are correlation and covariance. In practice, correlation is the only one used frequently and as a starting point of univariate or multivariate analysis.
Correlations can indicate a predictive relationship between one or multiple variables. For example, an electrical utility may produce less power on a mild day based on the correlation between electricity demand and weather. In this example, there is a causal relationship, because extreme weather which causes people to use more electricity for heating or cooling.
There is a famous saying in the statistical community – correlation does not imply causation. For example, at some point in time there was a case study which said that any country outside of the USA where there is a McDonald's franchise has never gone to war (maybe after WWII). There seems to be a correlation between war and a McDonald's franchise. Does it mean that having a McDonald's franchise is a means for world peace? Therefore, this proves the point that correlation does not imply causation.
Calculate descriptive statistics coefficients using R and T-SQL
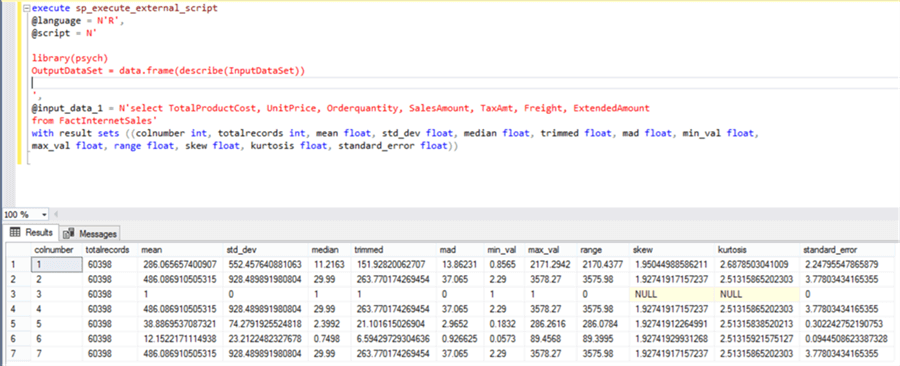
Consider that we have a sample data stored in a SQL Server database in some table. We intend to measure different statistics like mean, median, standard deviation, standard error, range, etc. We can use the psych package in R and apply it on the dataset to generate a number of descriptive statistics coefficients as shown below.
execute sp_execute_external_script
-
@language = N'R',-
@script = N'-
 -
library(psych)-
OutputDataSet = data.frame(describe(InputDataSet))-
 -
',-
@input_data_1 = N'select TotalProductCost, UnitPrice, Orderquantity, SalesAmount, TaxAmt, Freight, ExtendedAmount -
from FactInternetSales'-
with result sets ((colnumber int, totalrecords int, mean float, std_dev float, median float, trimmed float, mad float, min_val float, -
max_val float, range float, skew float, kurtosis float, standard_error float))
In the above code, we are reading a table from the database, and using the psych library in R, where we are applying the describe function on the input data read from the table. The output schema is defined in the with result sets clause. Upon execution, the result looks as shown below.
If you understand these statistics clearly, with just two lines of R code you can derive a number of statistics that can tell you a lot about the structure and spread of data. Some statistics like skew, kurtosis, standard error, trimmed mean, mean absolute deviation, etc. are not discussed. This is an assignment task for you to research and learn for yourself, as statistics is a very wide subject and you may have to develop a habit of researching new concepts yourself.
These figures need some practice to analyze and interpret. Visual analysis is relatively easier to explore and analyze the data. We will learn some visualization techniques for exploratory data analysis in the next section.
Additional Information
- Consider learning the formulas first, followed by their significance in understanding the structure, spread or probability.
