By: Ben Snaidero
Overview
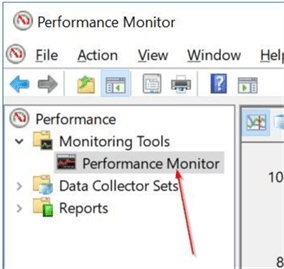
Almost every IT professional who works in a Windows environment has at least some experience using Performance Monitor to monitor performance counters in real-time. Since it comes installed with the operating system and is fairly intuitive to use it's usually the first tool I look to when starting to investigate a system performance issue. Collecting data in real-time is simply done by adding and removing counters from the main Performance Monitor window which can be shown by selecting the following item after you launch the application.
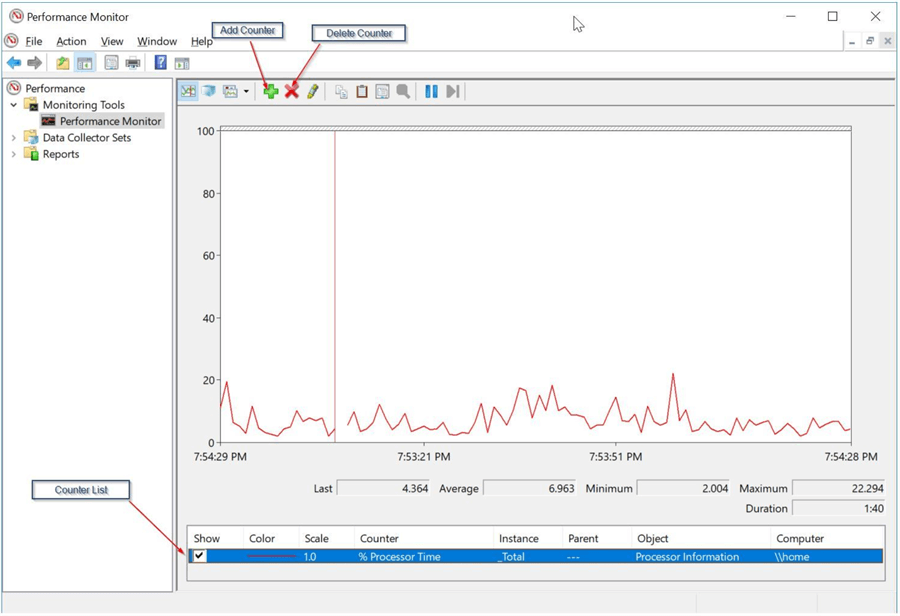
Once that has been selected you will get the following screen which by default will display the "% Processor Time" counter. You can see the list of counters being displayed in the legend highlighted below. Counters can be added or deleted using the menu buttons highlighted at the top of the screenshot. To remove a counter simply select it from the list at the bottom and then click the "X" button shown below.
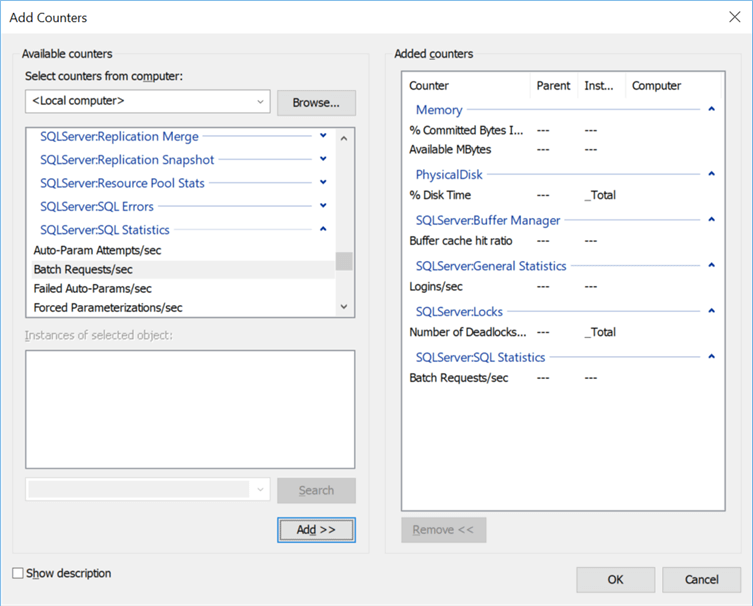
Adding a counter is obviously more than just the one step of selecting the "+" button. Once this button is selected you will be presented with another window which will allow you to select the counter(s) that will be displayed. You can see in the screenshot below that I have selected a bunch of SQL Server and system related counters. You can add counters by selecting it on the left and then clicking the "Add>>" button at the bottom. To remove counters you just select the counter you want to remove from the list on the right and click "Remove<<". Once you are done click "OK".
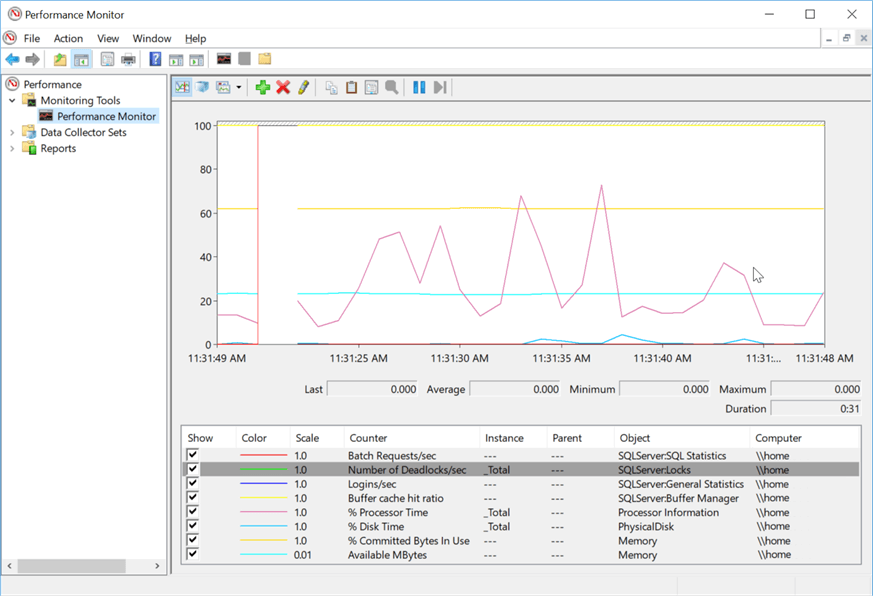
After clicking "OK" you'll be brought back to the main Performance Monitor screen and all the counters you selected will be displayed on the graph as shown below.