By: Ben Snaidero
Overview
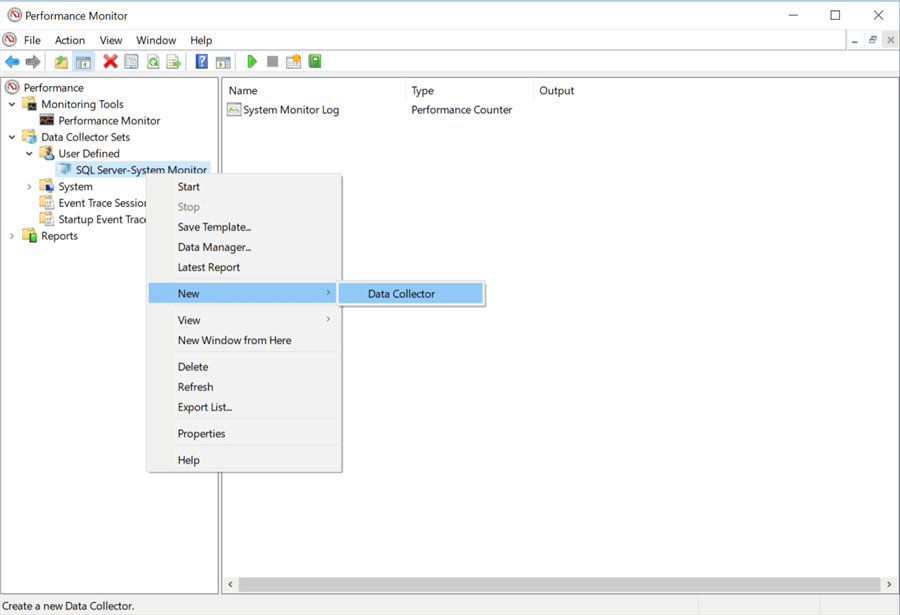
We can also create performance counter alerts by right-clicking our data collector set and select "New" > "Data Collector".
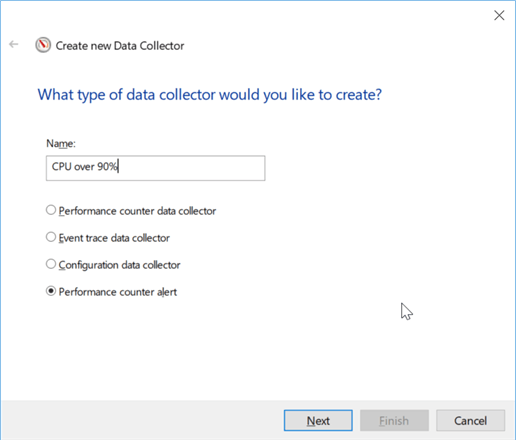
Once selected we get a new window where we can add another Performance counter data collector or any of the following other types: Event trace data, Configuration data or a Performance counter alert. We won't go through all the different types here, but we will go through adding a Performance counter alert as it is the other type that I find most useful. To configure this item we use the following window to give it a name and select the "Performance counter alert" radio button.
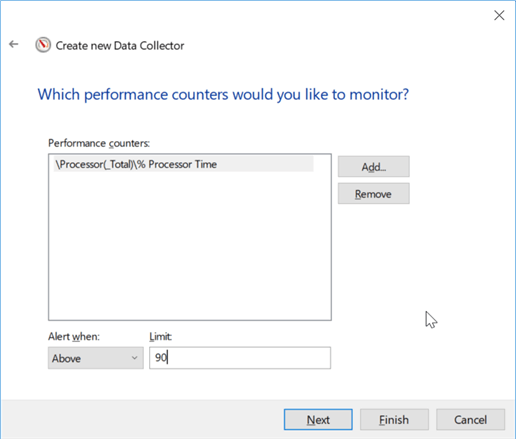
After we click "Next" we get the following window where we can add the counters that we would like to monitor. Clicking "Add" will open the same window we used earlier when adding performance counters to monitor in real time. Once you have selected the counter you can define when this alert is triggered. For this example, we will alert when the total CPU is above 90%.
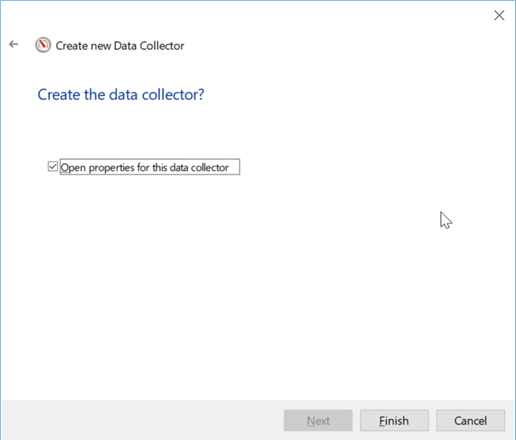
After clicking "Next" we get the following window where we complete the creation of this data collector. In this step we also select the "Open properties for this data collector" before clicking "Finish" so that we can also setup the actions when the threshold for this alert is exceeded.
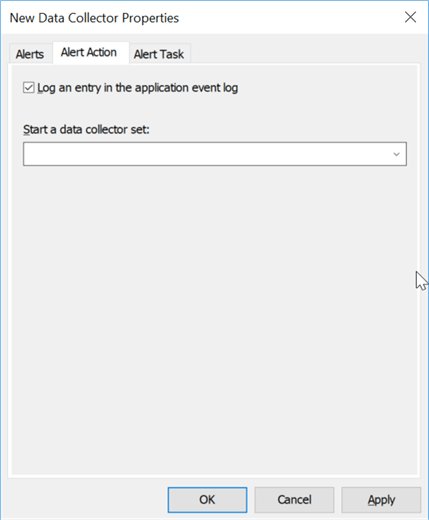
Within the properties dialog box for the performance counter alert data collector you can setup other tasks to run from the "Alert Task" tab. You can also start another data collector set, from the "Alert Action" tab. I usually just log an entry to the Windows event log so I can go back later and look at other data collector logs for that timeframe to investigate.