Problem
I have a fact table in my data warehouse that tracks durations of certain events as the total number of seconds that have passed. When users browse the cube, I’d like to show these durations formatted as time using the hh:mm:ss format (hours:minutes:seconds). How can I do this in Analysis Services (SSAS)?
Solution
First of all we need a use case to analyze. In this tip, we’ll look at different customer representatives that are assigned to service tickets. In a fact table, we track how long it took in seconds to resolve a ticket.
Track Duration in Seconds for a Fact Table
Let’s create the customer representative dimension and insert 4 representatives. The following script can be used:
CREATE TABLE dbo.DimRepresentative(
  SK_Representative INT NOT NULL
 ,Name    VARCHAR(50) NOT NULL
 CONSTRAINT [PK_DimRepresentative] PRIMARY KEY CLUSTERED
 (
  SK_Representative ASC
 )
);
GO
INSERT INTO dbo.DimRepresentative(SK_Representative,Name)
VALUES  (1,'Bruce')
  ,(2,'Selena')
  ,(3,'Gordon')
  ,(4,'Harvey');
Next we need a fact table to track the durations.
CREATE TABLE dbo.FactCustomerService
 (SK_CustomerServiceFact INT IDENTITY(1,1) NOT NULL
 ,SK_Representative  INT NULL
 ,TicketNumber   UNIQUEIDENTIFIER NOT NULL DEFAULT NEWID() -- degenerate dimension
 ,TicketTimestamp  DATETIME2(3) NOT NULL
 ,Duration    INT NOT NULL);
Let’s populate it with 100 random durations, randomly assigned to a representative and also randomly spread out over 100 days.
INSERT INTO dbo.FactCustomerService(SK_Representative,TicketTimestamp,Duration)
SELECT
  SK_Representative = FLOOR(RAND()*4) + 1 -- random assign a duration to a customer representative
 ,TicketTimestamp = DATEADD(DAY,RAND()*100,'2014-01-01')
 ,Duration   = RAND()*100000;
GO 100
The RAND() function is used to generate pseudo-random numbers. The SSMS batch separator GO is followed by the number 100. This ensures the preceding batch is executed 100 times which results in 100 rows being inserted into the fact table.
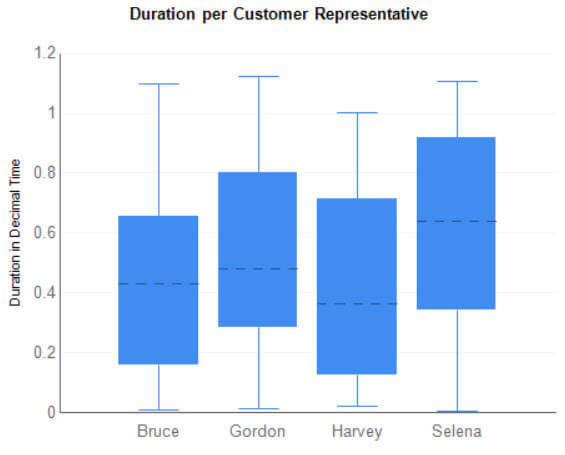
As an interface to the SSAS cube, we are going to use a view on top of this fact table. This view has a column TicketMonth that will serve as a mini-time dimension, allowing us to analyze the duration on a monthly basis. An additional column MonthOrder will be used to make sure the months are sorted chronologically and not alphabetically (more on that in the next section). Finally, the duration column is divided by 86,400 (the number of seconds in a day). This gives us a time representation in decimal time.
CREATE VIEW dbo.CustomerServiceFact_Cube
AS
(
SELECT
  SK_CustomerServiceFact
 ,SK_Representative
 ,TicketNumber
 ,TicketTimestamp
 ,TicketMonth = CONCAT('2014, ',DATENAME(MONTH,TicketTimestamp)) -- concat is SQL 2012+ only
 ,MonthOrder  = MONTH(TicketTimestamp) -- used for sorting in the report/cube
 ,Duration  = Duration / 86400.0
FROM dbo.FactCustomerService
);
GO
The following box plot illustrates the data we’ve just generated:
Build the SSAS Cube
The first step is creating a data connection to the database where you’ve created the objects from the previous section. Next a data source view is created that contains the fact table (using the view) and the representative dimension. A connection is created between both tables on the key column SK_Representative.

Let’s create the representative dimension next. Kick off the dimension wizard and choose an existing table. Take Sk_Representative as key column and Name as name column.

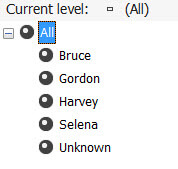
The final Representative dimension looks like this:

After processing you can take a look at the different representatives using the Browser. By default, SSAS adds an Unknown member.
The time dimension is next. Start the dimension wizard and again choose an existing table. Choose the fact table and configure TicketMonth as both key and name column.

In the next screen, deselect DimRepresentative as related table.

Make sure you also select the Month Order column. It doesn’t need to be browsable.

The final Month dimension looks like this:
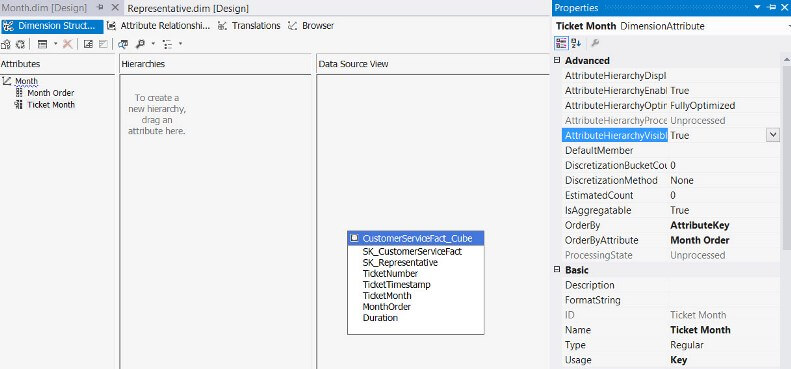
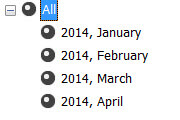
TicketMonth is sorted by Month Order by setting the OrderByAttribute property. To learn more about sorting in SSAS, take a look at the tip Sorting a dimension attribute by another dimension attribute in SQL Server Analysis Services. To verify the months and their sort order, you can process the dimension and take a look with the Browser.
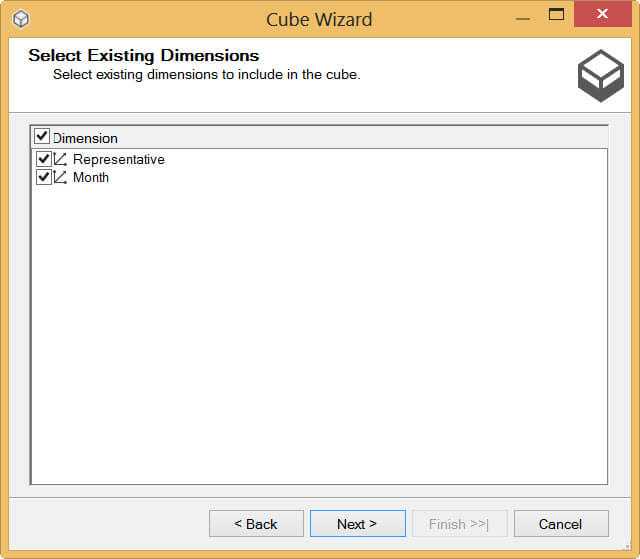
As the last step, we need to create the cube and a measure group. Start the cube wizard and select the fact table as an existing table. In the next screen, we need to choose the measures. Pick Duration and the automatically generated count.

Select both dimensions to be included in the cube.
At the final step, name the cube CustomerService.

The created cube has the following structure:

The dimension usage is automatically configured by the wizard and normally no intervention is needed.

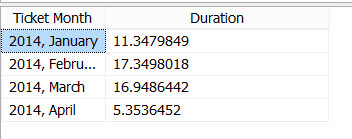
The cube is now finished. After processing it, you can take a look at the data through the Browser.

Formatting the time durations in SSAS
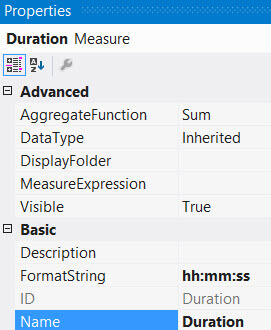
In the case that your durations are relatively short, you can simply format the measure directly using the FormatString property. All you have to do is set it to hh:mm:ss.
Unfortunately, you cannot verify the formatting in the cube browser since SQL Server 2012. It does work though in earlier versions of SQL Server.
So if we want to check if the formatting actually works, we need to go to Excel. There’s an Analyze in Excel button in the cube browser that takes us directly to an Excel pivot table.

In Excel we get the following results:

The grand total clearly illustrates the problem with this formatting: days are not taken into account. Once you go over 24 hours, the formatting starts right back at 0 hours. Excel itself has a format string that deals with this issue: [h]:mm:ss. Unfortunately SSAS doesn’t recognize this alternative formatting. This means the proposed format string of hh:mm:ss can only suit our needs if the duration is never longer than 1 day.
If we need to deal with longer durations however, we have two options: either construct a custom format string using MDX or create a new measure that displays strings.
The first option is explained by the blog post Custom format string for “duration” using MDX by Davy Knuysen. In this tip, I’ll explain the second method to achieve our goal.
The following MDX code will create a new calculated measure that will display the duration the way we want it.
CREATE MEMBER CURRENTCUBE.[Measures].[DurationFormatted]
 AS   Cstr((Int([Measures].[Duration]) * 24)
    + CInt(FORMAT(CDate([Measures].[Duration]), "HH")) )
    + FORMAT(CDate([Measures].[Duration]), ":mm:ss")
,VISIBLE = 1
,ASSOCIATED_MEASURE_GROUP = 'Customer Service';
Using some Visual Basic functions, we parse the decimal time number and format it to the format string we need. The advantage of this method is that the formatting can be verified in the cube browser, since we are not actually using formatting, but just displaying strings.
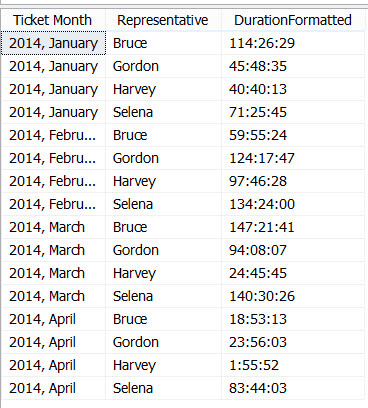
The downside is that we need to create an extra measure in the cube. The original duration measure can be hidden though if needed. The results look like this in Excel:

Next Steps
- Try it out yourself. You can use the code from this tip to create the fact and dimension tables.
- If you want to learn more about generating random data, check out the tip Populating a SQL Server Test Database with Random Data.
- You can find more SSAS tutorials here.

Koen Verbeeck is a seasoned business intelligence consultant with over a decade of experience with the Microsoft Data Platform. He holds several certifications, including Azure Data Engineer. He’s a prolific writer, with over 375 articles on technologies such as Microsoft Fabric, SSIS, ADF, SSAS, SSRS, MDS, Power BI, Snowflake and Azure services. He has spoken at various events such as PASS, SQLBits, dataMinds Connect and many others. He frequently delivers educational webinars on MSSQLTips.com. For his efforts, Koen has been awarded the Microsoft MVP data platform award for many years.
- MSSQLTips Awards:
- Leadership Award (200+ Tips) – 2021
- Author of the Year – 2014/2020/2022
- Author Contender – 2024/2025