Problem
What are some of the most common mistakes when working with Power BI? For example, when a junior colleague starts on a Power BI project for the first time, what are the pitfalls you try to warn them about? What advice would you give them?
Solution
This tip presents a list of frequently encountered pitfalls of Power BI projects. It’s by no means an exhaustive list. You’re always welcome to add additional “mistakes” or “worst” practices in the comments section.
Let’s take a look at these Power BI common pitfalls.
#1 – Not Paying Attention to Data Modeling
Power BI was introduced as a self-service business intelligence (BI) and data visualization tool years ago. It was designed to be user-friendly (although its complexity has risen over the past few years). You don’t need to be a data modeling genius to work with Power BI to get interesting results. For small ad-hoc analyses or proof-of-concepts, just using a single big table might be good enough. But, if you want an enterprise-grade model that is scalable, secure, and performant, a bit more thought should go into the model.
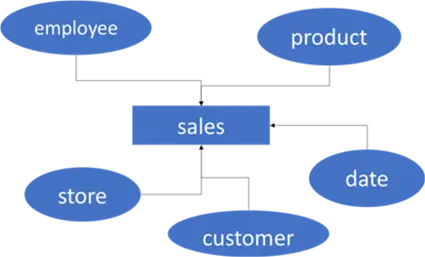
Ideally, Power BI works with one or more star schemas. This means transactional data (sales, returns, stock levels, etc.) is stored in fact tables, while descriptive information (customer data, product info, dates, store locations, etc.) is stored in dimensions.
A better data model leads to more intuitive reporting, better performance, and in most cases, easier DAX formulas. The importance of star schemas for Power BI is documented by Microsoft. There’s also a YouTube video about it that I recommend watching.
Additional information can be found in the tip Star Schema Data Modeling for Power BI.
#2 – Doing All the ETL in the Model
Without a doubt, some thought should go into the modeling aspect of a semantic model in Power BI. But this doesn’t mean that everything should be done in the model. Sometimes, people try to put every piece of business logic into DAX formulas. DAX is a powerful language but isn’t always the best fit for every use case. Stuffing all your logic into calculated columns or tables will have an impact on the complexity and performance of your model. Also, keep in mind that if you have a calculated column on a partitioned table, this entire column will need to be recalculated every time one or more partitions are refreshed.
If possible, calculations should be pushed back to the source systems as far as possible. Matthew Roche from Microsoft has formulated this into a maxim:
“Data should be transformed as far upstream as possible, and as far downstream as necessary.”
This means that calculations are ideally done in the source query or the data warehouse. If that’s not possible, you should implement them in Power Query. Only when all those options are not available then a DAX implementation should be considered.
#3 – Not Using Naming Conventions
The semantic model you create in Power BI Desktop will eventually be a user interface for report developers or any business users connecting directly to the model (i.e., with the Analyze in Excel feature). You should have no cryptic column names but rather well-defined and clear attribute and measure names. It doesn’t help if there are measures called “Revenue,” “Revenue Test,” and “Revenue 2025.”
Another example is code and description attributes in the dimensions, such as employee code or product description. Don’t just name them “code” and “desc.” Use “employee code,” “employee name,” “product code,” and “product description.” Ideally, every attribute or measure name is unique in the model, so try to avoid situations like this:

It gets worse when you add those columns to a visual:
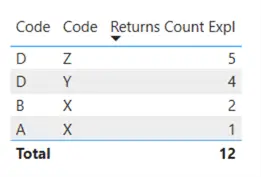
It is unclear which table and which column is used. The user will need to hover over the attributes in the field list to get a tooltip with the fully qualified name:

Report developers can still rename the attributes when used in a visual, but it is always better to have a good naming standard in place in the semantic model.
#4 – Too Many Visuals on One Page
Aside from the fact that too much information on a single report page might be too daunting or distracting for a user, having excessive visuals on one page has a clear performance impact. You can easily see this when using the Performance Analyzer (found in the View pane of the ribbon in Power BI Desktop).
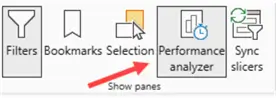
Learn more about working with this tool in the tip Power BI Performance Analyzer.
For example, when I have a report page with four different card visuals, there are four different queries issued when the page is refreshed:

If we combine those card visuals into one multi-row card visual, we see there’s only a single query issued:

The exact same data is presented to the user, but less than 1/4th of the resources are used. If you have slow reports, check if either visuals can be removed from the page to be put on other pages or if you can combine multiple visuals into one visual.
#5 – Not Using Source Control
Alright. This one might be forgivable if you’re doing a proof-of-concept or a one-shot analysis. However, once you start collaborating with multiple people on a single model, implementing source control is a must. Of course, it doesn’t help that until recently Power BI had very poor source control support. This changed with the introduction of two features:
- Power BI Project Format. When a model is saved as a Power BI Project (.pbip file extension), the data and metadata of the model are saved separately, instead of one big .pbix file. So, the Power BI model files now take up only a couple of kilobytes (depending on how many report pages you have). The model itself is also saved like a SSAS Tabular project (one big model file containing all definitions).
- TMDL Language. You also have the option to save the semantic model of a Power BI project in the TMDL format. TMDL is a new format language for Power BI that replaces JSON. In short, it allows you to store the different objects of a model as separate files. For example, if you have four tables in your model, you will have four different TMDL files, each describing a table. This makes integration into source control much easier since developers can work on different tables simultaneously without causing conflicts.

Both options are still in preview, and need to be explicitly enabled in the settings:
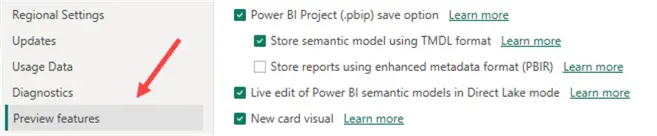
There’s also a new way of storing report visuals (PBIR) to make them easier to handle in source control, but at the time of writing, there were still some disadvantages which is why it’s not enabled in the screenshot.
Next Steps
- Do you know common pitfalls of your own? Tell us about them in the comments!
- You can learn more about TMDL in this blog post.
- Chris Webb has an excellent blog post on why having too many visuals is a bad idea: Power BI Report Performance And The Number Of Visuals On A Page
- You can find more Power BI tips in this overview.
