Problem
What advice would you give to someone new to Power BI? What are common Power BI mistakes to avoid? In this article, we will discuss several Power BI mistakes to avoid to help you navigate this powerful tool effectively.
Solution
In the tip, Top 5 Power BI Worst Practices, we highlighted five common mistakes when working with Power BI. This tip discusses additional pitfalls that didn’t make the top five.
Power BI Mistakes to Avoid Continued
#6 – Inefficient DAX
DAX, the formula language used for measures and calculated columns in Power BI, can be an incredibly powerful language. But when written in a suboptimal manner, it brings a model to a halt. First, DAX seems quite easy because it’s modeled after the Excel formula language. However, when formulas become more complex, writing good DAX code becomes exponentially more difficult. For example, this is prevalent when you deal with row and filter context and how to manipulate those with CALCULATE.
It’s impossible to talk about all the intricacies of DAX in one single article, so we’ll keep it to two examples.
Example 1: Not Using Variables
Let’s create a formula where the same calculation is done multiple times. You can optimize the performance by using a variable. Suppose we have the following DAX measure:
[myMeasure] =
    IF(NOT(ISBLANK([measureA])),[measureB] * [measureA],[measureB])
The problem is that measureA is evaluated twice. If this is an expensive calculation, performance will suffer. We can optimize this DAX formula by using variables:
[myMeasure] =
    VAR varA = [measureA]
    RETURN
        IF(NOT(ISBLANK(varA)),[measureB] * varA,[measureB])
Aside from performance improvements, DAX variables also make formulas easier to read and reduce complexity. Another instance of this is provided in a different tip: Improve Power BI Performance with Auto Date/Time and DAX Variables.
Example 2: Iterating Over Large Tables
Some DAX functions will iterate over each row of a table to calculate the output. Similar to T-SQL, iterating over a large data set row by row can be incredibly slow. Power BI will typically handle this quite well for smaller data sets because everything is in memory. However, if your tables get larger, you may suddenly see performance get worse.
A common issue is using the FILTER function to filter out rows. FILTER iterates over the rows and returns a table result, which can be used in CALCULATE. Suppose we have the following measure:
[myMeasure] = CALCULATE([measureA], FILTER('Countries', 'Countries'[Name] = 'Belgium')A better way to write the same measure is using a Boolean expression instead, and using the KEEPFILTERS function to preserve any existing filter context:
[myMeasure] = CALCULATE([measureA], KEEPFILTERS('Countries'[Name] = 'Belgium')Get a more detailed explanation in this blog post: CALCULATE and FILTER: A Love Story?
#7 – Poor Governance
Often many users, not only IT or the data team, create models and reports in the Power BI service. If there’s no central governance, the Power BI service can turn into chaos, having many workspaces, abandoned artifacts, and reports and no one knows if they’re actually being used.
Implementing a data governance strategy is key to a successful Power BI environment roll-out. A lot of data governance information can be found in the official Power BI Adoption Roadmap.
Some tips to get you started include:
- Review the Power BI/Fabric Admin Settings. Limit the number of users who can create workspaces, or who can create Power BI items. Some settings have the entire company as the default.
- Learn More about the Environment Using Power BI Admin APIs. Use it to get lists of present assets, such as workspaces, models, reports, etc. See the scanner API for more information.
- Exact Data Regularly from the APIs. Some APIs only return results for a certain amount of time. By extracting data frequently from the APIs, it can be stored in a datastore, making it possible to analyze what is happening in your tenant.
- Log Information with Azure Log Analytics. You can also use Azure Log Analytics to log Power BI tenant information. The more you measure, the more you know.
- Add Microsoft Purview. Microsoft Purview can be integrated into Power BI for more governance and data lineage.
- Utilize Third-Party Tools. There are also third-party tools that can help you with governance, such as Power BI Sentinel.
#8 – Not Using External Tools
Usually open-source and community-driven, there are many different external tools to help with your Power BI development. It is possible to create high-performance, scalable models, and the most beautiful reports without ever touching an external tool. Not using them will not make you a bad Power BI developer; but if you do use them, they will make your life easier.
You can launch them from inside the Power BI ribbon:
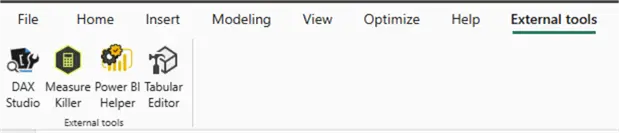
Here are some of the more popular external tools.
A text-based editor for the semantic model, it comes in handy especially when there are large models that have become slow to handle in Power BI Desktop. Until recently, a lot of features could only be implemented in Tabular Editor, such as perspectives, calculation groups, and modifying the IsAviailableInMDX property. However, some of these features have made it into Power BI Desktop or they can now be modified using the TMDL view.
Tabular Editor still has a lot to offer, such as macros, the best-practice analyzer, DAX formatter, copy-pasting artifacts, etc. There are two versions available: Tabular Editor 2 (open-source and free) and Tabular Editor 3 (a paid product with even more features).
This tool is everything you need to write complex DAX queries, including advanced performance tuning options. Examples include viewing the compute time in the storage or formula engine and retrieving the column/table sizes of your model, which can be used in the Vertipaq Analyzer. DAX Studio is free to download.
This external tool scans your model and reports to find which columns or measures are not used, allowing you to remove them from your model. There’s a free and paid version of the product.
There are more useful external tools; check them out in the documentation.
#9 – Treating Security as an Afterthought
Business analytics projects typically deal with large amounts of corporate data, and not all data should be viewed by everyone. A report displaying sensitive data to everyone in the company equals a nightmare scenario. Avoid this by building security directly into the Power BI model and/or service. Several options are:
In the Power BI Service, using workspace roles limits the number of people who can access reports and models. Choose from admin, member, contributor, and viewer. Ideally, only a select number of people have admin and member rights. Only people needing to work on reports should have contributor rights. In my opinion, nobody should have viewer rights, because you can expose reports to business users through apps. Only the data/reporting team should be in the workspace; viewers should use apps.
When you create an app with several reports, you can assign one or more audiences. These allow you to specify who can view which reports.
Roles
Both workspace roles and app audiences only specify who can access what. If users have access to a report or model and no additional security mechanisms are in place, they can see all the Power BI model data. One step further would be to use roles, and there are two options:
- Object-level Security. Ability to hide columns or entire tables from a user. They cannot see it in the field list. Measures using a blocked column or table will display an error message.
- Row-level Security. Users can still see the table, but some rows will be filtered out. For example, a role can be created that filters on Department = HR. People belonging to that role will only see data for the HR department. One step further is dynamic row-level security, where data is filtered based on the user account of the user viewing the report or model. For instance, this is for a user who should only view their own sales data.
A good overview of security measures in Power BI is described in the following tip: Power BI Row-Level, Column-Level and Object-Level Security.
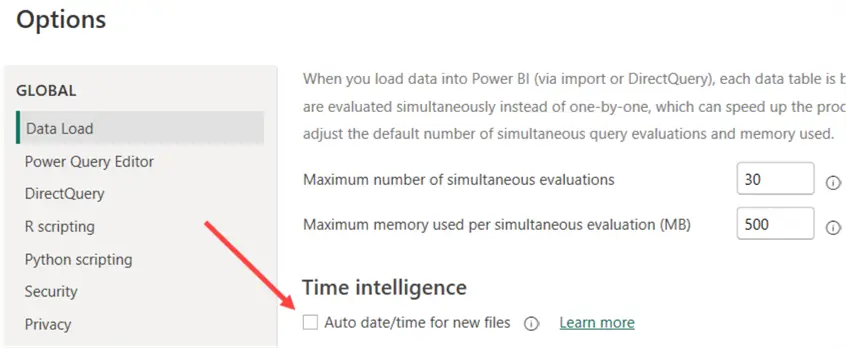
#10 – Not Knowing the Defaults
As with all software and programming languages, be aware of the defaults. There’s the infamous auto date/time feature that creates a date table for each date column in your model. This can be a real issue as the hidden data tables are created from the min and max dates of the column. If this column contains dummy dates like 1900-01-01 and 2999-12-31, you might end up with a whole bunch of large date tables consuming excessive amounts of memory. Turn this feature off as fast as you can!
Another default setting is to automatically detect relationships.
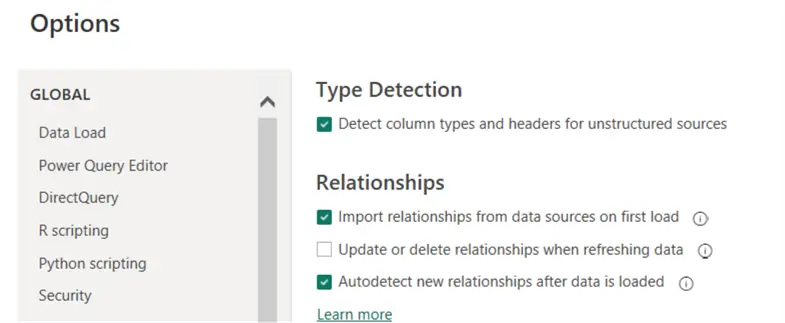
If you’re not careful, Power BI might create relationships where you don’t expect them, especially if tables have columns with the same name (such as InsertDate and UpdateDate).
Another default is to create implicit measures for every numeric column. However, not every numeric column should be able to be summarized, i.e., it makes no sense to sum a “year” column.
Next Steps
- Do you think some “bad practices” are missing from the list? Let us know in the comments!
- If you haven’t already, check out the first part of this tip: Top 5 Power BI Worst Practices.
- More interesting Power BI tips:
- You can find all Power BI tips here.

Koen Verbeeck is a seasoned business intelligence consultant with over a decade of experience with the Microsoft Data Platform. He holds several certifications, including Azure Data Engineer. He’s a prolific writer, with over 375 articles on technologies such as Microsoft Fabric, SSIS, ADF, SSAS, SSRS, MDS, Power BI, Snowflake and Azure services. He has spoken at various events such as PASS, SQLBits, dataMinds Connect and many others. He frequently delivers educational webinars on MSSQLTips.com. For his efforts, Koen has been awarded the Microsoft MVP data platform award for many years.
- MSSQLTips Awards:
- Leadership Award (200+ Tips) – 2021
- Author of the Year – 2014/2020/2022
- Author Contender – 2024/2025


