By: Tibor Nagy
Overview
In this section we will walk through a simple query using the AdventureWorksDW database.
Explanation
We will run a simple query and examine the Actual Graphical Execution Plan.
Let's filter the products table based on ProductSubcategoryKey and list records where ProductSubcategoryKey equals 1.
So our query looks like this:
SELECT ProductKey, ProductSubcategoryKey
FROM AdventureWorksDW..DimProduct
WHERE ProductSubcategoryKey = 1
Open a new query window and press CTRL+M to include the Actual Execution Plan and then execute the above query.
The Actual Query Plan for this query is shown below. (hover over the image to see the ToolTips)
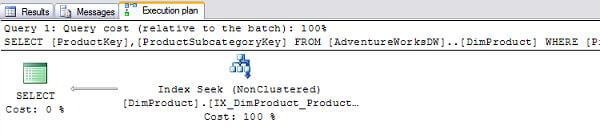
You can see in the above image that SQL Server processed the query this way:
- Index Seek on a NonClustered index on the DimProduct table (cost 100%)
- Select to return the result set (cost 0%)
To analyze the query plan we should look for the following items to pin down the possible improvements:
- resource intensive operations where the percentage is high,
- scan operations and
- width of arrow between operators (the fatter the arrow the more data)
In our example 100% of the resources were used by the NonClustered Index Seek operation on the DimProduct table.
In our query we are filtering on ProductSubcategoryKey in the WHERE clause, but because the Index that is used contains both ProductKey and ProductSubcategoryKey a simple index seek operation could fulfill the request.
Let's check the details of the Index Seek operation!
Point your mouse over the Index Seek icon in the Execution Plan and a ToolTip should appear like the one below:
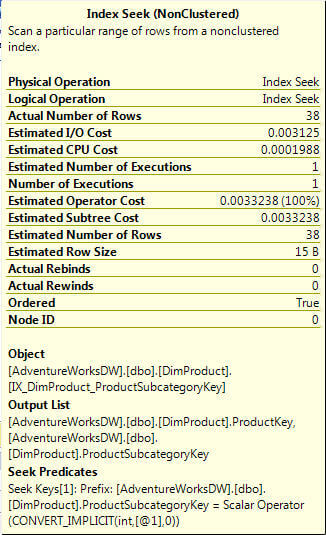
You can see in the ToolTip that only one execution (Number of Executions) was required and it returned 38 (Estimated Number of Rows) ordered (Ordered = True) rows.
Let's check the details of the arrow between operation!
Point your mouse over the arrow between the SELECT and Index Seek and a ToolTip should appear like the one below:
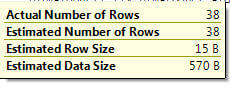
This shows that 38 rows were passed from the Index Seek to the SELECT and the size of the data transfer which was 570 bytes.
Let's check the details of the SELECT operation!
Point your mouse over the SELECT icon in the Execution Plan and a ToolTip should appear like the one below:
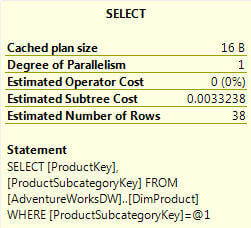
Once again we can see that 38 rows were returned.
A thing to note here is the Estimated Subtree Cost. Since this is the left most operation this is the overall cost for the query plan. The cost is also used to help SQL Server determine when to use a parallel execution plan.
So how can we improve the performance?
For this query there is nothing that can be done. The overall Estimated Subtree Cost is very low and we are also doing an Index Seek to get the data. It doesn't get much better than that.
