By: Koen Verbeeck
Overview
So far in this tutorial we have seen different types of window functions: aggregate, ranking and analytical (lag and lead. In this part, we’ll highlight the statistical functions, which are part of the analytical functions.
PERCENTILE_DISC and PERCENTILE_CONT
Both functions calculate a percentile based on the discrete and the continuous distribution correspondingly. The main difference between the two functions is that PERCENTILE_DISC will return a value from the data set while PERCENTILE_CONT will interpolate values.
The syntax for these functions is a bit different than other window functions:
PERCENTILE_CONT(percentile) WITHIN GROUP (ORDER BY expression) OVER (PARTITION BY expression)
The WITHIN GROUP clause specifies the numerical vales over which the percentile should be computed over. The percentile literal indicates the percentile value to calculate, which is a decimal number between 0.0 and 1.0. Let’s calculate the 75-percentile of the online sales for each product category.
SELECT DISTINCT
     [c].[EnglishProductCategoryName]
    ,[Sales - 75th perc cont] = PERCENTILE_CONT(0.75)
                                        WITHIN GROUP(ORDER BY [f].[SalesAmount])
                                        OVER(PARTITION BY [c].[EnglishProductCategoryName])
    ,[Sales - 75th perc disc] = PERCENTILE_DISC(0.75)
                                        WITHIN GROUP(ORDER BY [f].[SalesAmount])
                                        OVER(PARTITION BY [c].[EnglishProductCategoryName])
FROM [dbo].[FactInternetSales]      f
JOIN [dbo].[DimProduct]             p ON [p].[ProductKey]            = [f].[ProductKey]
JOIN [dbo].[DimProductSubcategory]  s ON [s].[ProductSubcategoryKey] = [p].[ProductSubcategoryKey]
JOIN [dbo].[DimProductCategory]     c ON [c].[ProductCategoryKey]    = [s].[ProductCategoryKey];
In this case, both the discrete and the continuous distribution yield the same results:
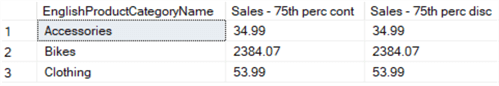
The 75th percentile of Bikes is 2384.07, which means that for 75% of sales the amount was lower than 2384.07, while for 25% is was higher. When specifying 0.5 as the percentile, you are calculating the median value. With these two new functions in your toolbox, you can easily calculate summary statistics for a data set. Let’s do this for the employee salaries:
SELECT DISTINCT
     [DepartmentName]
    ,MinRate    = MIN([BaseRate]) OVER (PARTITION BY [DepartmentName])
    ,[25thPerc] = PERCENTILE_CONT(0.25) WITHIN GROUP (ORDER BY [BaseRate]) OVER (PARTITION BY [DepartmentName])
    ,MedianRate = PERCENTILE_CONT(0.50) WITHIN GROUP (ORDER BY [BaseRate]) OVER (PARTITION BY [DepartmentName])
    ,AvgRate    = AVG([BaseRate]) OVER (PARTITION BY [DepartmentName])
    ,[75thPerc] = PERCENTILE_CONT(0.75) WITHIN GROUP (ORDER BY [BaseRate]) OVER (PARTITION BY [DepartmentName])
    ,MaxRate    = MAX([BaseRate]) OVER (PARTITION BY [DepartmentName])
FROM [dbo].[DimEmployee]
ORDER BY MedianRate DESC;
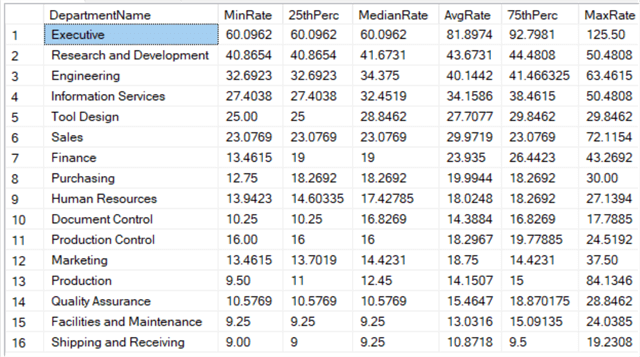
The results:
The CUME_DIST and PERCENT_RANK functions
The CUME_DIST function is closely to the PERCENTILE_DIST function: it returns the relative position of a value compared with other values in the data set. In other words, it returns the percentile of a specific value. The PERCENT_RANK function is similar to CUME_DIST.
Let’s illustrate the concept using the values we found in the previous paragraph, by retrieving the percentiles for the different sales amount of the category accessories:
SELECT DISTINCT
     [c].[EnglishProductCategoryName]
    ,f.[SalesAmount]
    ,CumeDist       = CUME_DIST()    OVER (ORDER BY f.[SalesAmount])
    ,PercentRank    = PERCENT_RANK() OVER (ORDER BY f.[SalesAmount])
FROM [dbo].[FactInternetSales]      f
JOIN [dbo].[DimProduct]             p ON [p].[ProductKey]            = [f].[ProductKey]
JOIN [dbo].[DimProductSubcategory]  s ON [s].[ProductSubcategoryKey] = [p].[ProductSubcategoryKey]
JOIN [dbo].[DimProductCategory]     c ON [c].[ProductCategoryKey]    = [s].[ProductCategoryKey]
WHERE [EnglishProductCategoryName] = 'Accessories';
The results are a bit surprising:
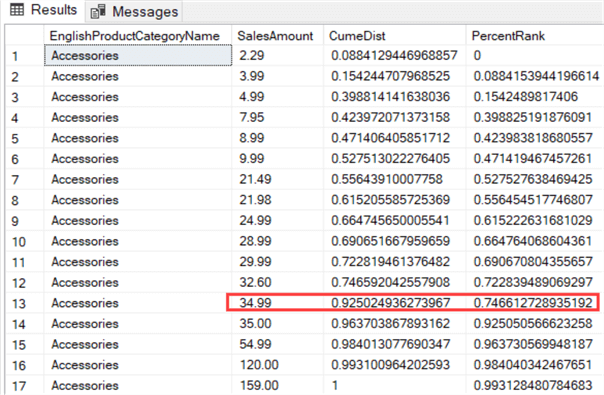
The CUME_DIST function returns 92%, while in the previous section the value 34.99 was determined as the 75th percentile. Why this big of a difference? Remember, we are working with discrete functions here. The previous value, 32.60 has the 74th percentile, which is lower than 75 so the next value has to be taken. In this example, that’s 34.99 which happens to have a much higher CUME_DIST value. The PERCENT_RANK function on the other hand is much closer to 75%.
Additional Information
- Extra information about the analytical functions described in this part:
- This tip explains how you can use summary statistics to create box plots in Reporting Services: Creating a box plot graph in SQL Server Reporting Services
