Problem
In a previous tip we developed a Personal Finance Calculator in Power BI. In this tip, we will enhance what we did in the first part of the series to get a better understanding of how to use Power BI features.
Solution
It is recommended to read the previous tip here to develop the Personal Finance Calculator. In this tip, I will be showcasing how to extend the functionality of the application further.
We will cover how transactions can be grouped into transaction categories and how these categories can be used for further analysis. In addition, we will create more metrics to analyze the transactions. At last we will create a dashboard to represent daily expense analysis and expense analysis by category.
Creating a Simple KPI
We will be creating three KPIs named “Latest Expense Date”, “Oldest Expense Date” & “Total Number Of Transactions”.
A measure “Latest Expense Date” has been created with the DAX expression below
Latest Expense Date = Max(Transactions[Transaction Date])
A measure “Oldest Expense Date” has been created with the DAX expression below
Oldest Expense Date = Min(Transactions[Transaction Date])
A measure “Total Number Of Transactions” has been created with the DAX expression below
Total Number Of Transactions = COUNT(Transactions[Debit Amount])
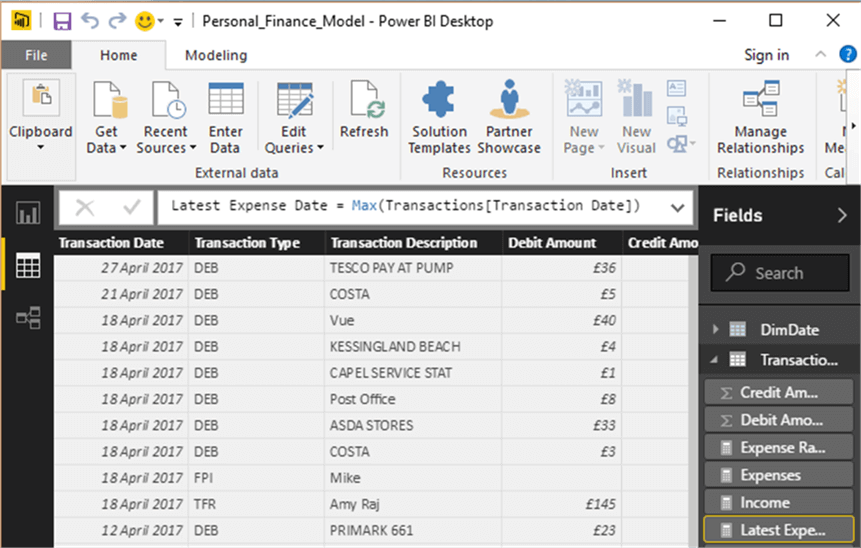


These KPIs have been added to the dashboard and the image below represents this data.

Daily Expense Analysis
Now the daily expenses can be analyzed using the column chart in report mode. As the image below shows, the transaction date can be added in the axis and the expenses can be added to the value field. Once added, the chart will look like the image below.


As the expense transactions are spread across many dates in a given month, the labels are shown only for a few. However, this can be resolved by changing the Type to “Categorical” in the X-Axis.

Now the label details are available for every day in the chart.

Expense Analysis by Category
To support expense analysis by category, I have created a lookup data in an Excel sheet. This sheet has only two columns named TransactionDescription and TransactionCategory.

This Excel workbook can be imported into the Power BI model as shown below.

The name of the query/table has been renamed as TransactionCategoryLookup. I have noticed that the column names available in the first row were not used by Power BI.

This can be easily achieved by using the option “Use First Row As Headers” as per the image below. Now the columns have been defined correctly for the lookup query.

Now close and apply to create the lookup table named “TransactionCategoryLookup”.

Creating a relationship
Now let’s create a relationship between the Transactions table and the TransactionCategoryLookup table with the TransactionDescription column. This relationship will help us do a lookup in the Transactions table.

A calculated column “TransactionCategory” can be added in the transactions table to lookup the value of TransactionCategory from the lookup table. This can be achieved by using the DAX expression below.
TransactionCategory = RELATED(TransactionCategoryLookup[TransactionCategory])

As we have the TransactionCategory, now we can develop a report to analyze the expense by Transaction Category.
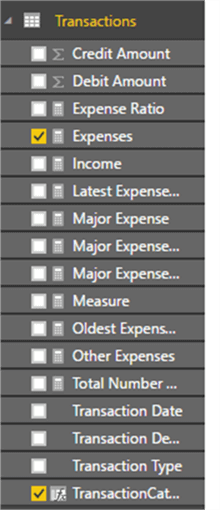
This can be achieved by adding a table to the report pane and selecting the columns “TransactionCategory” and “Expenses” from the transactions table. The image below represents the transactions table and the selected columns in the report pane.
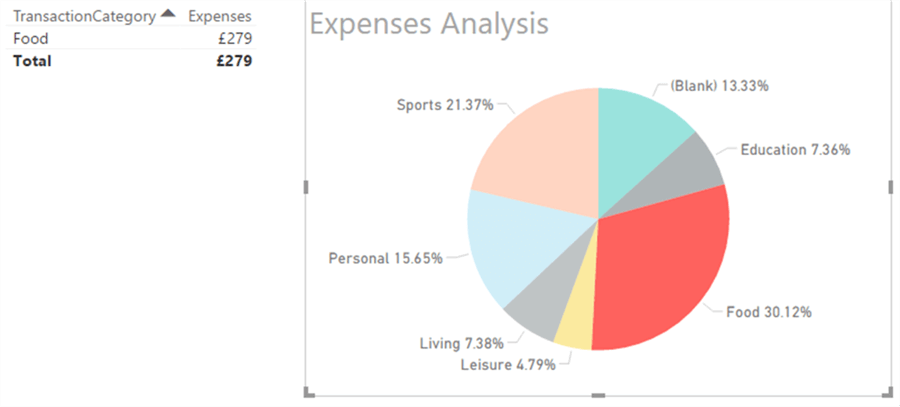
The report will be displayed with Transaction Category and expenses as shown below.

A pie chart can be developed for a visual representation. The same two columns “Transaction Category” and “Expenses” in the transactions table can be used for this report as well. The image below shows the Transaction Category column has been identified for the Details section and the Expenses column has been identified for the Value section.

Now the pie chart has been generated for the expense analysis by category. The pie chart represents the percentage of overall expenses for a category. If you hover over a specific category, the actual expense amount for that category will be displayed in the tooltip.

In addition, a specific category can be highlighted by selecting that category. The category “Food” has been highlighted in the image below.
Now click anywhere on the pie chart to go back and display all category expenses.
Displaying Blank Values
In the report it displays “Blank” as a category. This means for some transactions we don’t have the category in the lookup table.
The image below represents the “blank” category in the table and the pie chart.

If you prefer not to display the blank category at all, then you can do so using the advanced filter. As we have many reports showing blank as category, the filter can be applied at the page level.
On the page level filters, select the Transaction Category column and select the advanced filtering options. On the drop down select the “is not blank” value. Once done the blank category will be removed and the report will look like below.

Although this is a solution to remove the blank category, the risk is not displaying all of the transactions. Let’s say we have many transactions not being mapped, then we will be missing out on these details in the report. So it is always good to include the blank category in the report or try to map these transactions to categories.
So to improve the presentation, we can group all the unmapped transactions into “Others” category. This can be done by enhancing the DAX expression for the lookup column.
Now let’s add a new calculated column “TransactionCategoryNew” to the transactions table as shown below.

The below DAX expression has been used to calculated the new column.
TransactionCategoryNew =
var LkpValue= RELATED(TransactionCategoryLookup[TransactionCategory])
return
IF(Len(LkpValue)=0,"Others",LkpValue)
In the above DAX expression, the value of TransactionCategory has been looked up in the lookup table using the related function and the lookup value will be stored in a variable “LkpValue”. In the next step the variable will be validated for a blank value using the length function. If the value is blank then the string “Others” will be returned. From the above image, it is clearly visible that the new DAX expression has provided the value as “Others” for unmapped values.
Now let’s replace the new calculated column “TransctionCategoryNew” with the old column on the table and the pie chart. From the below image it is confirmed that the “Others” category is visible and this will help us to understand the unmapped categories.

Summary
In this tip, we have enhanced the Power BI model to analyze expenses based on Category. This model can be extended further to include budgeting analysis.
As individuals tend to have multiple bank accounts (personal, current, credit card, etc.) the format of the transactions also may be slightly different. In the next tip, I will help you extend the model to accommodate this functionality.
Next Steps
- Stay tuned to read the next tip to analyze personal finance with budget analysis.
- Read more about Summarize function.
- Read other Power BI Tips here.

Nat Sundar is working as an independent SQL BI consultant in the UK with a Bachelor’s Degree in Engineering. He has considerable years of experience with the UK Financial Services Industry (mainly in Insurance and Investment Banking).
He is passionate about SQL Server, SSIS, SSAS, SSRS and MDX. He has presented at SQLBits, SQLPass and the SQL London User Group. He has special interest towards Continuous Integration, Continuous Delivery and Deployment automation for the SQL BI (SSIS, SSAS and SSRS) stack.
He can be contacted at sqlnat@gmail.com, via LinkedIN and on Twitter at @SQLNat.


Hi Nat, thanks for sharing this. Really helpful as have created something like this myself but it’s far from perfect and looking to start from scratch to perfect it. Some great ideas in this article for me.
Are you able to share your excel keyword lookup? Do you have more than one account you bring into this? If so do you go throb a manual process of exporting from your banks and consolidating or have you managed to automate the process?
Thanks
James