Overview
This section will show you how to launch the SQL Profiler tool and start a simple trace session with the default template.
Explanation
There are few ways to launch SQL Server Profiler. Depending on the version of Windows you are using you can launch SQL Profiler from the Start Menu or from the Metro Interface on more recent releases. I prefer however to just launch it from SSMS since I always have this open anyway. As you can see in the screenshot below you can find SQL Profiler under the tools menu.

Once the application starts you are presented with the dialog shown below which will allow you to connect to the server that you want to profile. Remember from the best practices section we should be connecting to a remote server and not running this against a local SQL Server instance. Once you’ve filled in your connection details click “Connect”.

Now that you are connected to the server you are presented with the “Trace Properties” window which has two tabs. The first tab, “General” (shown below), which allows you to:
- Name the trace.
- Select a template to collect the data. Templates are basically a saved set of events and data columns that you want to trace. They allow you to quickly start a trace without having to manually select all the events and data columns each time you start a new trace session. Microsoft provides a bunch of templates which you can see below and by default the “Standard” template is selected. In a later topic in this tutorial, I will show how you can create and save your own templates as well as what the other options on this tab are used for. For now we will just leave all the defaults selected.
- Define where to save your trace data if you don’t just want to view it in the GUI.
- You have the option to save the data to a file and specify the rollover parameters (hidden by the template options).
- You have the option to save the data to a table and specify the number of rows in the table.
- Define a stop time for the trace.

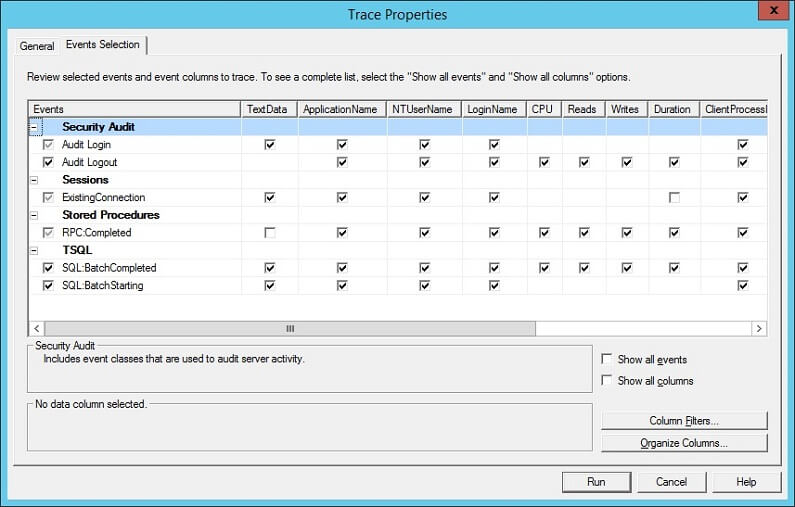
The second tab in this window, “Events Selection”, is where you can configure what events you want to monitor and which data columns you want included for each event. On this tab you can also add filters and change the way the data is organized in the bottom right of the interface. We explain more about these options in a later topic in this tutorial. You can see below that since we selected the “Standard” template on the previous tab the events and data columns are already populated. At this point you can edit this as required or simply click “Run” to start the trace as is.
After you click the “Run” button on the bottom right of the screen you should see the screen below and as events are captured they will be displayed in this window.

And there we have it, our trace is running. To pause or stop the trace you can use the buttons in the toolbar. These buttons work just as you would suspect. If you stop the trace the next time you hit play you will start a brand new trace. You will lose all of the events you collected with the first run unless you save the data before restarting (we’ll show you how to do this in a later topic in this tutorial). If you pause the trace you will not lose any of the data you collected earlier when you resume, but you will miss any events that occurred while the trace was paused.
Additional Information

Ben Snaidero has been a Database Administrator for just over 10 years. Starting out working mainly with Oracle he got into SQL Server in 2005 and has worked primarily with SQL Server for the last 3 years. His main focus with both Oracle and SQL Server is in the area of performance tuning.
- MSSQLTips Awards: Achiever (75+ tips) – 2018 | Author of the Year Contender – 2016-2017