By: Ben Snaidero
Overview
In this topic we will look at how we have the ability to control the data column order in the SQL Profiler output window.
Explanation
Although it's not really an issue if we are saving the SQL trace data to a file or to a table (as you can rearrange the output from those sources when you query it), the "Organize Columns" button gives you the ability to control the order in which the data columns are displayed in the SQL Profiler output window. This can come in handy when you are capturing a lot of data as you can keep the most important data visible in the output window at all times and only have to scroll over to see the other columns when necessary.
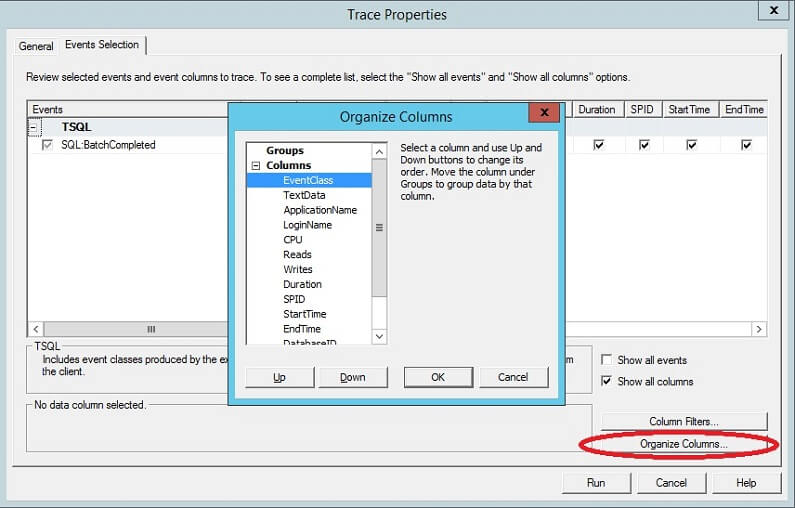
The "Organize Columns" button is available on the "Events Selection" tab as shown below. Once clicked it will display a dialog box which will allow you to move the data columns up and down. The data columns at the top of the list will appear in this order from left to right in the trace output window.

The one column that is usually the largest and if expanded won't fit on one screen is the TextData column. As this column is usually quite important I keep it on the left so it's visible, but reduce the width of the column in the output window to only display a subset of the column data.
Additional Information
- Complete Event Class Reference
