By: Ben Snaidero
Overview
An event is just what you would think it is, basically an activity that occurred on your SQL Server database instance. Below we will identify a few of the more important events and show you how to add these to your trace using SQL Profiler.
Explanation
There are over 150 different events that can be configured in a trace. A complete listing with a detailed description is noted in the additional items at the bottom of this topic, but below are some of the more common events that you will almost always find configured in a trace.
| Event | Description |
|---|---|
| RPC:Completed | Indicates that a remote procedure call has completed. |
| SQL:BatchCompleted | Indicates that a Transact-SQL batch has completed. |
| Deadlock graph | Provides and XML description of each deadlock event, Lock:Deadlock. |
| Audit Login | Indicates that a user has successfully logged in to the SQL Server instance either as a brand new connection or one that was reused from a connection pool. |
| Audit Logout | Indicates that a user has successfully logged out of the SQL Server instance either as a brand new connection or one that was reused from a connection pool. |
How to add SQL Server Profiler Events
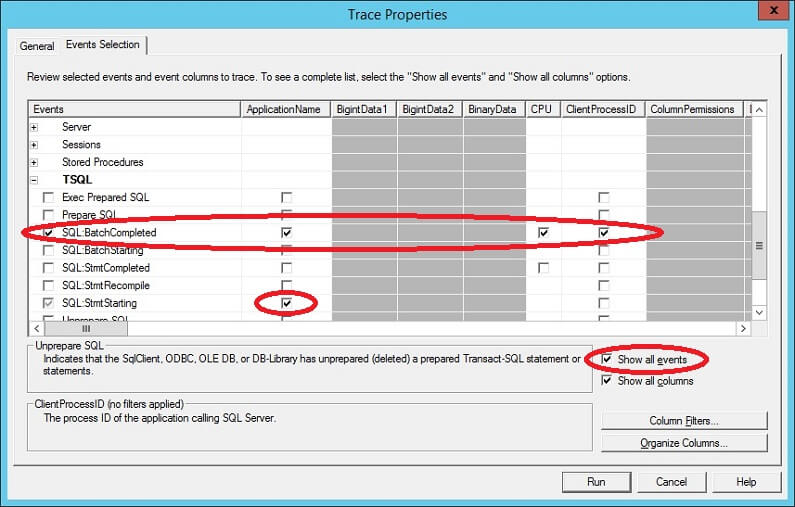
To add events to a trace session we go to the "Events Selection" tab I showed in the previous topic. If you notice in the screenshot below there is a checkbox "Show all events" on the bottom right of the screen. If you check this box it will list all the events in the window above. I also check the "Show all columns" checkbox so that when I select the event all the data columns are selected (more on this in the next topic in this tutorial). Once all the events are displayed you simply check the events you want to include in your trace. In my example below I selected all data columns for the SQL:BatchCompleted event and only the ApplicationName data column for the SQL:StmtStarting event.
Additional Information
- Complete Event Class Reference
