By: Ben Snaidero
Overview
A data column is a piece of data that describes some part of an event that occurred in your database. Things like login, start_time, event success or failure are all different types of data that can be collected for an event that is configured in your SQL trace session.
Explanation
There are over 60 data columns that can be added to a trace, but depending on which event you have selected a given data column may or may not be available depending on whether or not it is applicable to that event. A complete listing with a detailed description is noted in the additional items at the bottom of this topic. Please note that in order to see the description of the data columns that are available you need to first select the event you are interested in configuring. Below are some of the more common data columns that you will almost always see selected for an event if it's applicable.
�@| Event | Description |
|---|---|
| TextData | Text of the batch of statements entered. i.e. a TSQL command |
| LoginName | Name of the user who that executed the statement, either a SQL or Windows login |
| CPU | Amount of CPU in milliseconds used by the statement. |
| Reads | Number of page read I/Os caused by the statement. |
| Writes | Number of page write I/Os caused by the statement. |
| Duration | Amount of time taken in milliseconds for the statement to complete. |
| SPID | ID of the session on which the event occurred. |
| StartTime | Start time of the event. |
| EndTime | End time of the event. |
| DatabaseName | Name of the database in which the statement is running. |
| DBID | Database identifier in which the statement is running. |
| HostName | Name of the computer on which the client who is executing the statement is running. |
| ServerName | Name of the SQL instance being traced. |
| RowCounts | Number of rows (if any) effected by the event. |
| Error | 0= OK, 1=Error, 2=Abort |
How to add Data Columns in SQL Server Profiler
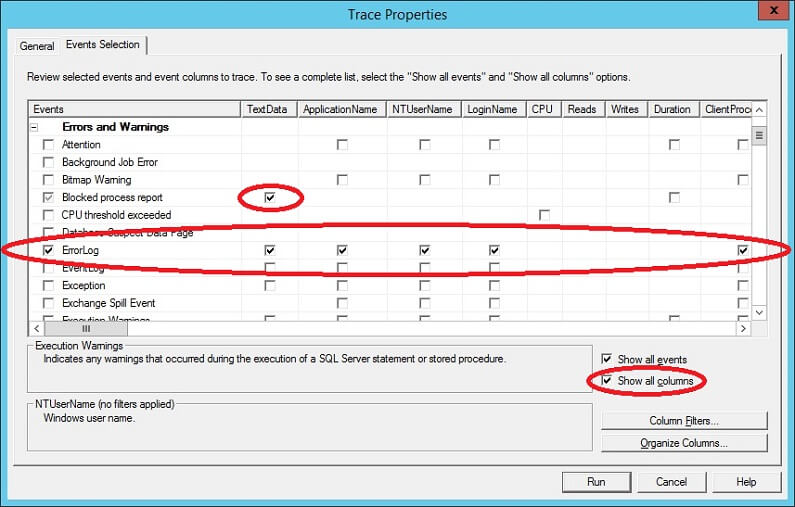
To add data columns to a trace session we go to the "Events Selection" tab I showed in the previous topic. If you notice in the screenshot below there is a checkbox "Show all columns". If you check this box the window above will display checkboxes for each data column that is available for any events that are open. Alternatively you can select individual data columns for each event. To select the data columns you can either select the data column itself or select the event which will check every data column for that event (as we did in the previous topic). In my example below I selected all data columns for the Errolog event and only the TextData data column for the Blocked process report event.
Additional Information
- Complete Event Class Reference
