By: Ben Snaidero
Overview
Despite SQL Trace/Profiler being deprecated for quite some time many people (me included) still use both of these features when troubleshooting issues in SQL Server. Outlined below are a few reasons why you should be using extended events instead of using a SQL Trace or Profiler.
Extended Events has less resource overhead compared to SQL Trace/Profiler
Anyone who has used SQL Profiler has no doubt run into the performance issues it can cause due to the resources it requires, especially when running it locally. I’ve always tried to use server-side traces in its place as it seems to use much fewer resources than SQL Profiler but as this link shows extended events has even less overhead than a server-side trace.
Extended Events allows you to capture more events compared to SQL Trace/Profiler
Ever since the very first release of the extended events feature back in 2008 there have been more events available in extended events than there are in SQL Trace. Every version of SQL Server since and including 2008 has 180 events available in SQL Trace. The first release of extended events had 243 events available and SQL Server 2016 now has over 1320 events.
Extended Events has built-in templates just like Profiler
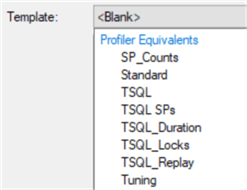
SQL Profiler had many built-in templates that you could use to start a trace quickly. These include: SP_Counts, Standard, TSQL, TSQL_Duration, TSQL_Grouped, TSQL_Locks, TSQL_Replay, TSQL_SPs, Tuning. Early versions of extended events did not have these templates but since SQL Server 2016 we now have equivalent templates available within the SQL Server extended events new session dialog as shown below.

Additional Information
- Convert Existing SQL Server Traces to Extended Events Sessions
- Extended Events equivalents to SQL Trace Event Classes
