By: Ben Snaidero
Overview
There are many different methods you can use for viewing the data collected by an extended events session. As with most things using the SSMS GUI is the easiest way to view data. Even within the GUI there are multiple ways to view the data.
View Extended Events Data Using Watch Live Data
The first method we will look at is using the "Watch Live Data" menu item. This can be found by expanding the "Management" node with Object Explorer. You then expand "Extended Events" followed by "Sessions" which will give you a list of your sessions. After right-clicking on the session you want to view you can then select "Watch Live Data" as shown below.
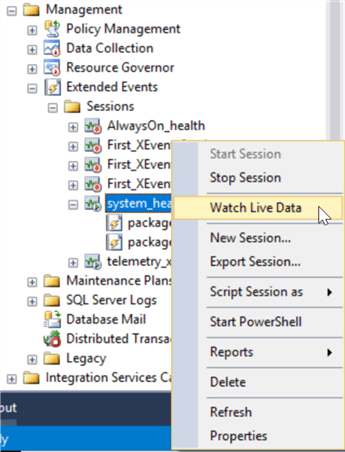
After selecting this the following tab will open which will display your event session data as it is collected.
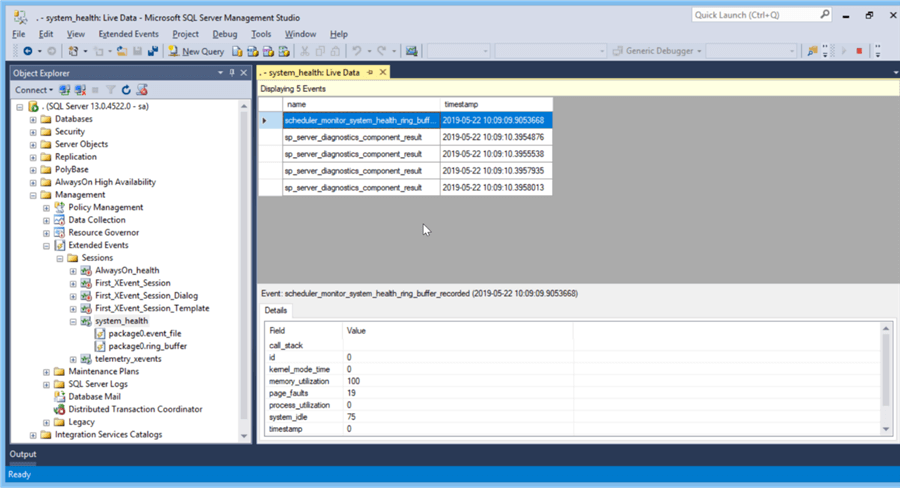
This method will only display new data as it is collected.
View Extended Events Data Using View Target Data
If you want to view previously collected data you can also do this by using the "View Target Data" menu item. For this item you follow the same steps as above but you'll also need expand the actual session you are interested in viewing and then right-click on the target type you wish to view as shown below.
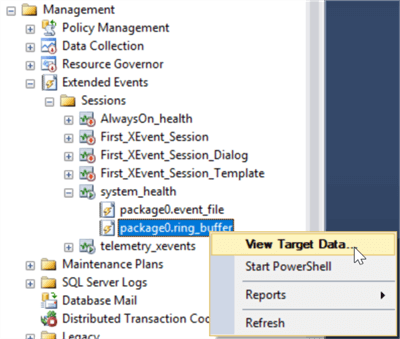
Once selected the following tab will open. Depending on the target type this tab will display differently. For the event_file type it will look just as it did when we selected "Watch Live Data". For the ring buffer target we selected above we get the following output.
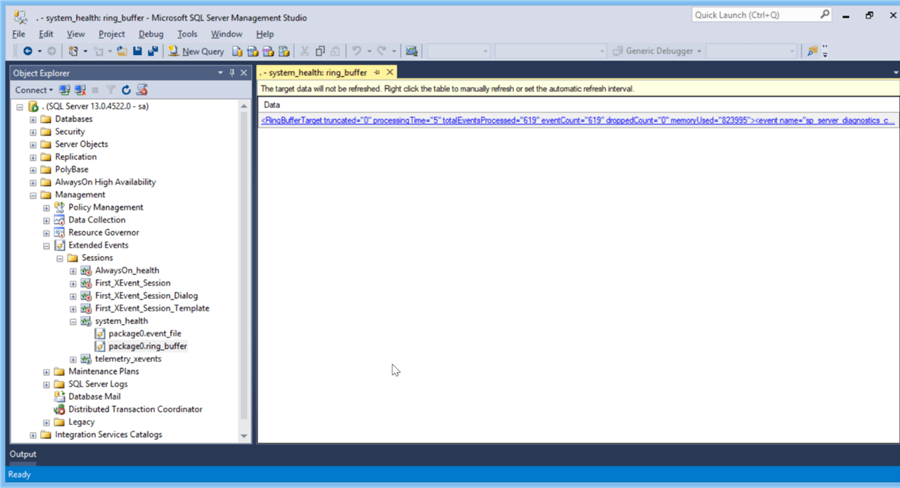
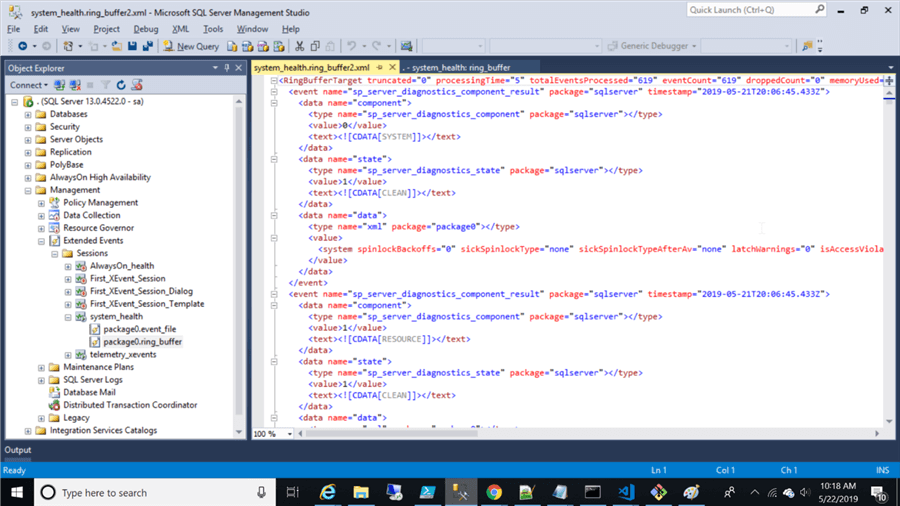
We can click on the column data returned in the output window and it will display the formatted XML output in a new tab as shown below.
View Extended Events Data Using XEvent Profiler
Finally, starting with SSMS ver17.3, we can use the XEvent Profiler. This tool is very similar to SQL Profiler in that it gives you a live streaming view of events you have configured. The difference with this tool though is that it is integrated directly into SSMS (not a separate tool like SQL Profiler was) and is built on top of the Extended Events framework.
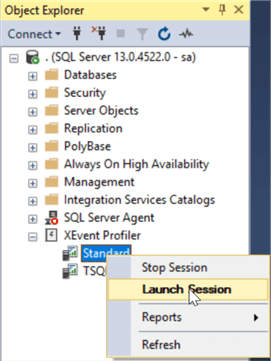
To start the XEvent Profiler we can open SSMS and under the main instance tree in Object Explorer we can expand the "XEvent Profiler" menu item and we should see two sessions as shown below. "Standard" will show all extended events and "TSQL" will show all logged SQL statements. You can launch a session by right-clicking one of these and then select "Launch Session" as shown below.
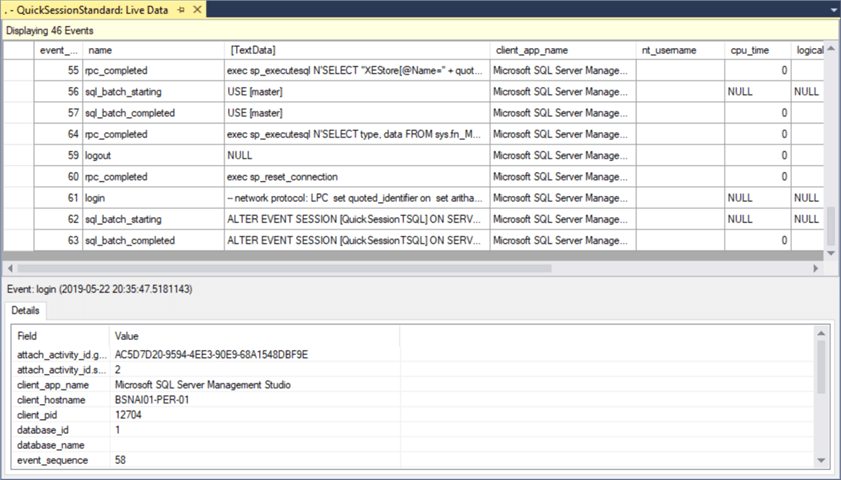
Once launched the following window will open which as you can see looks very much like the old SQL Profiler output window.
Also note that this output window is configurable. If you right-click on the column headings you can add/remove columns or search a column.
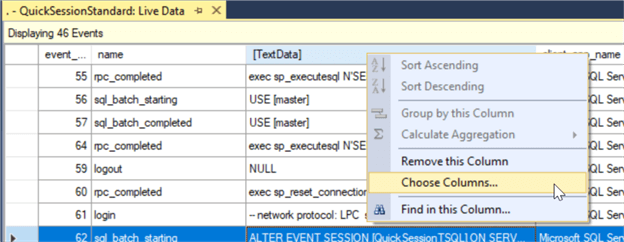
Also, if you right-click on a column value you can setup filters on the output.

View Extended Events Data Using T-SQL
We can also use TSQL to pull event data. The extended events DMVs contain the event data for most of the target types. All types except the event file type (in which case the file name is in the target_data column XML) and the ETW type have their data in the target_data column of the sys.dm_xe_session_targets view. We can join this view with the sys.dm_xe_sessions to get the event data for each target of an extended events session.
The below example shows how we can query this data from the system_health session.
SELECT s.name, st.target_name,st.target_data
FROM sys.dm_xe_sessions s
  INNER JOIN sys.dm_xe_session_targets st ON s.address = st.event_session_address
WHERE s.NAME = 'system_health';

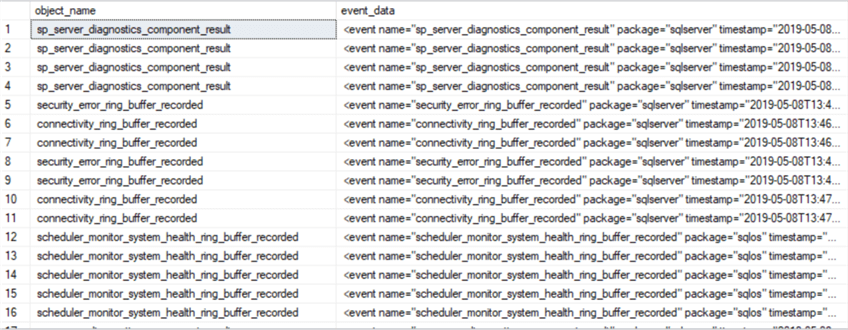
Although it's not in the sys.dm_xe_session_targets view, if you want to get the event file target data using TSQL you can use the sys.fn_xe_file_target_read_file function to read the files. The following example shows how we can use this function to read the system_health event session file data.
SELECT object_name,event_data
FROM sys.fn_xe_file_target_read_file('system_health*.xel',null,null,null);
Additional Information
- Query Data from Extended Events in SQL Server
- Advanced Viewing of Target Data from Extended Events
- Overview of XEvent Profiler in SQL Server Management Studio
