Problem
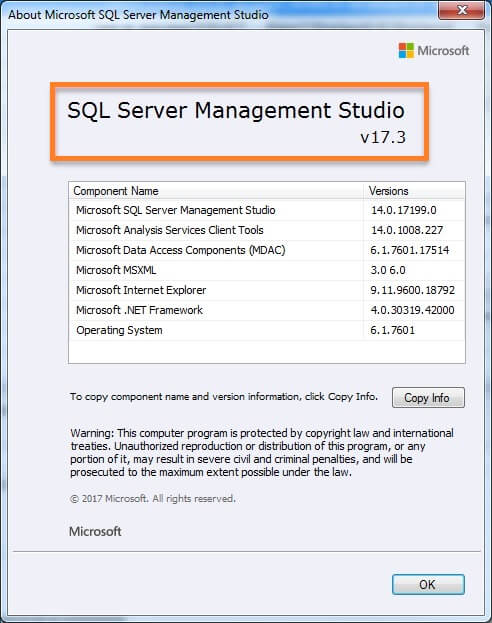
Extended Events play an important role for troubleshooting SQL Server issues. They were introduced in SQL Server 2008, however there was not a GUI interface available to make it easy to use Extended Events and therefore DBAs had to write complex T-SQL statements to gather the information they needed. In SQL Server 2012, SQL Server Management Studio (SSMS) included a GUI component to work with Extended Events and viewing event-related data. Now in SQL Server Management Studio v17.3, XEvent Profiler has been introduced and we will explore how to use XEvent Profiler in this tip.
Solution
When troubleshooting SQL Server, we have always used SQL Profiler which is a graphical tool to capture events occurring in your SQL Server instance by running a SQL Server trace. We could then easily identify long running queries, monitor T-SQL statements, identify slow running queries, analyze the SQL workload, etc. SQL Profiler is has been in use since SQL Server 7.0.
Extended Events (aka – XEvents) were launched in SQL Server 2008 as a replacement for a trace. With each new SQL Server version, there are many enhancements to the Extended Events. Microsoft planned for the depreciation of SQL Profiler to be replaced with Extended Events which provides a customizable definitions, views and events. The problem was that Extended Events lacks a quick view capability that is available in SQL Profiler, therefore many DBAs and developers still prefer using SQL Profiler over Extended Events.
SQL Server Management Studio 17.3 contains a new feature XEvent Profiler which provides a quick and customizable live view of the Extended Events. One of the main advantages of XEvent Profiler is that it is directly integrated into SSMS and is built on top of the Extended Events technology, where SQL Profiler was not integrated with SSMS and had its own interface.
XEvent Profiler is an SSMS feature, not a SQL Server feature and is available when we are connect to SQL Server 2012 or higher versions however you need to use SSMS v17.3 to use it.
To access the XEvent Profiler, connect to the SQL Server instance using SQL Server Management Studio v17.3.

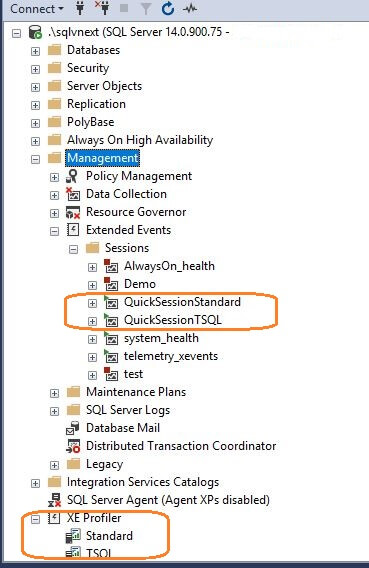
In the Object Explorer, we can see the new XE Profiler node as shown below:

As we can see above, XEvent Profiler is new and has two options:
- Standard - Displays all extended events
- TSQL - Displays the logged SQL statements
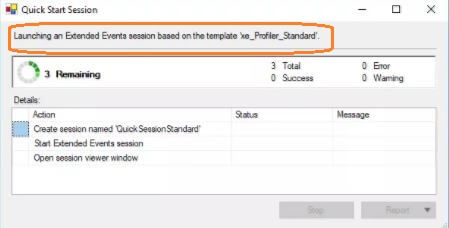
Once we double click on the Standard XEvent Profiler session, it launches a ‘Quick Start Session’. This session configures an Extended Events session based on the template ‘xe_Profile_Standard’. Similarly, if you click on TSQL XEvent profiler, it launches an XEvent session based on template ‘xe_Profile_TSQL’
Once a session is configured based one of the templates, we can find the predefined session templates by expanding the Management node to check all Sessions under the Extended Events node as shown below:
- QuickSessionStandard
- QuickSessionTSQL
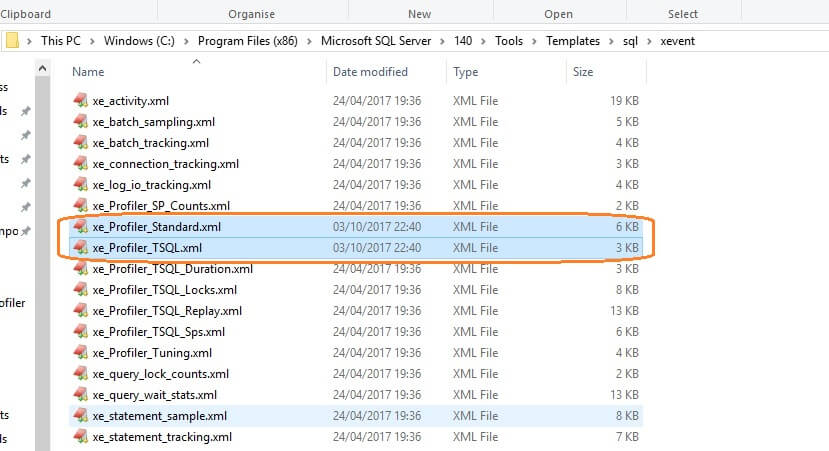
Definitions of both sessions are deployed as regular XEvent session templates. We can find them on the path Drive:\Program Files (x86)\Microsoft SQL Server\140\Tools\Templates\sql\XEvent.
QuickSessionStandard
QuickSessionStandard is created as a replacement for the ‘Standard’ template in Profiler. It contains generic Extended Events, so it can be a starting point. It captures all stored procedures and Transact-SQL batches that are being executed. We can use it to monitor general database server activity.
To script out the XEvent session, expand Management > Extended Events > Sessions and right click on the session and select Script Session as > CREATE To > New Query Editor Window.

The QuickSessionStandard script is shown below.
 CREATE EVENT SESSION [QuickSessionStandard]
ON SERVER
ADD EVENT sqlserver.attention
( ACTION
(
package0.event_sequence
,sqlserver.client_app_name
,sqlserver.client_pid
,sqlserver.database_id
,sqlserver.nt_username
,sqlserver.query_hash
,sqlserver.server_principal_name
,sqlserver.session_id
)
WHERE ( [package0].[equal_boolean]([sqlserver].[is_system], ( 0 )))
)
,ADD EVENT sqlserver.existing_connection
( SET collect_options_text = ( 1 )
ACTION
(
package0.event_sequence
,sqlserver.client_app_name
,sqlserver.client_pid
,sqlserver.nt_username
,sqlserver.server_principal_name
,sqlserver.session_id
)
)
,ADD EVENT sqlserver.login
( SET collect_options_text = ( 1 )
ACTION
(
package0.event_sequence
,sqlserver.client_app_name
,sqlserver.client_pid
,sqlserver.nt_username
,sqlserver.server_principal_name
,sqlserver.session_id
)
)
,ADD EVENT sqlserver.logout
( ACTION
(
package0.event_sequence
,sqlserver.client_app_name
,sqlserver.client_pid
,sqlserver.nt_username
,sqlserver.server_principal_name
,sqlserver.session_id
)
)
,ADD EVENT sqlserver.rpc_completed
( ACTION
(
package0.event_sequence
,sqlserver.client_app_name
,sqlserver.client_pid
,sqlserver.database_id
,sqlserver.nt_username
,sqlserver.query_hash
,sqlserver.server_principal_name
,sqlserver.session_id
)
WHERE ( [package0].[equal_boolean]([sqlserver].[is_system], ( 0 )))
)
,ADD EVENT sqlserver.sql_batch_completed
( ACTION
(
package0.event_sequence
,sqlserver.client_app_name
,sqlserver.client_pid
,sqlserver.database_id
,sqlserver.nt_username
,sqlserver.query_hash
,sqlserver.server_principal_name
,sqlserver.session_id
)
WHERE ( [package0].[equal_boolean]([sqlserver].[is_system], ( 0 )))
)
,ADD EVENT sqlserver.sql_batch_starting
( ACTION
(
package0.event_sequence
,sqlserver.client_app_name
,sqlserver.client_pid
,sqlserver.database_id
,sqlserver.nt_username
,sqlserver.query_hash
,sqlserver.server_principal_name
,sqlserver.session_id
)
WHERE ( [package0].[equal_boolean]([sqlserver].[is_system], ( 0 )))
)
WITH
(
MAX_MEMORY = 8192KB
,EVENT_RETENTION_MODE = ALLOW_SINGLE_EVENT_LOSS
,MAX_DISPATCH_LATENCY = 5 SECONDS
,MAX_EVENT_SIZE = 0KB
,MEMORY_PARTITION_MODE = PER_CPU
,TRACK_CAUSALITY = ON
,STARTUP_STATE = OFF
);
GO
As we can see the Standard session collects all stored procedures and T-SQL batches running to monitor the general database activities of the SQL Server instance, by collecting XEvents such as login, logout, rpc_completed, sql_batch_completed and sql_batch_starting.
QuickSessionTSQL
QuickSessionTSQL is used to capture all submitted T-SQL statements by collection XEvents such as login, logout, rpc_starting, and sql_batch_starting. It is very lightweight XEvent session. It is created as replacement for the ‘TSQL’ template in Profiler.
The QuickSessionTSQL script is shown below.
 CREATE EVENT SESSION [QuickSessionTSQL]
ON SERVER
ADD EVENT sqlserver.existing_connection
( ACTION ( package0.event_sequence, sqlserver.session_id ))
,ADD EVENT sqlserver.login
( SET collect_options_text = ( 1 )
ACTION ( package0.event_sequence, sqlserver.session_id )
)
,ADD EVENT sqlserver.logout
( ACTION ( package0.event_sequence, sqlserver.session_id ))
,ADD EVENT sqlserver.rpc_starting
( ACTION ( package0.event_sequence, sqlserver.session_id )
WHERE ( [package0].[equal_boolean]([sqlserver].[is_system], ( 0 )))
)
,ADD EVENT sqlserver.sql_batch_starting
( ACTION ( package0.event_sequence, sqlserver.session_id )
WHERE ( [package0].[equal_boolean]([sqlserver].[is_system], ( 0 )))
)
WITH
(
MAX_MEMORY = 8192KB
,EVENT_RETENTION_MODE = ALLOW_SINGLE_EVENT_LOSS
,MAX_DISPATCH_LATENCY = 5 SECONDS
,MAX_EVENT_SIZE = 0KB
,MEMORY_PARTITION_MODE = NONE
,TRACK_CAUSALITY = ON
,STARTUP_STATE = OFF
);
GO
Session Wizard
We can also use these templates from the New Session Wizard under the Extended Events node in SSMS. Just right click on the session and select New Session Wizard.

Working with XEvent Profiler
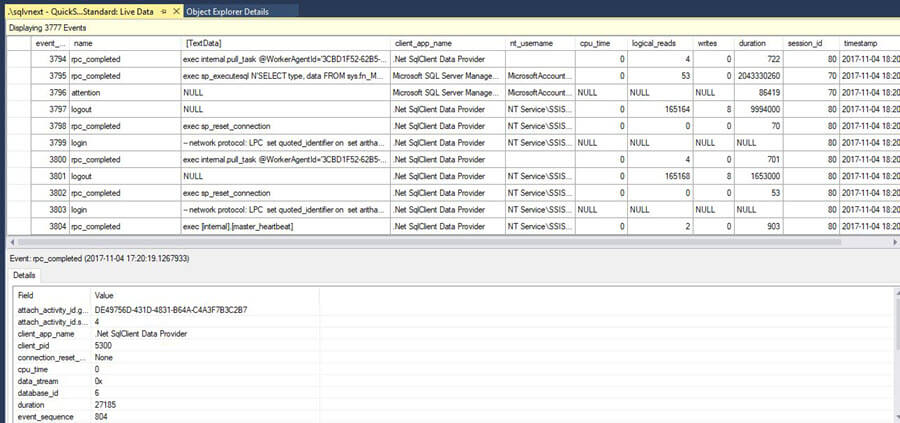
To use XEvent profiler, double-click on the TSQL XEvent Profiler template. For example, if I click on the QuickSessionStandard session, it quickly opens up the live data window.
This live data window displays all logged T-SQL statements currently running as per the standard session definition, with a detailed view of each selected event as shown below.
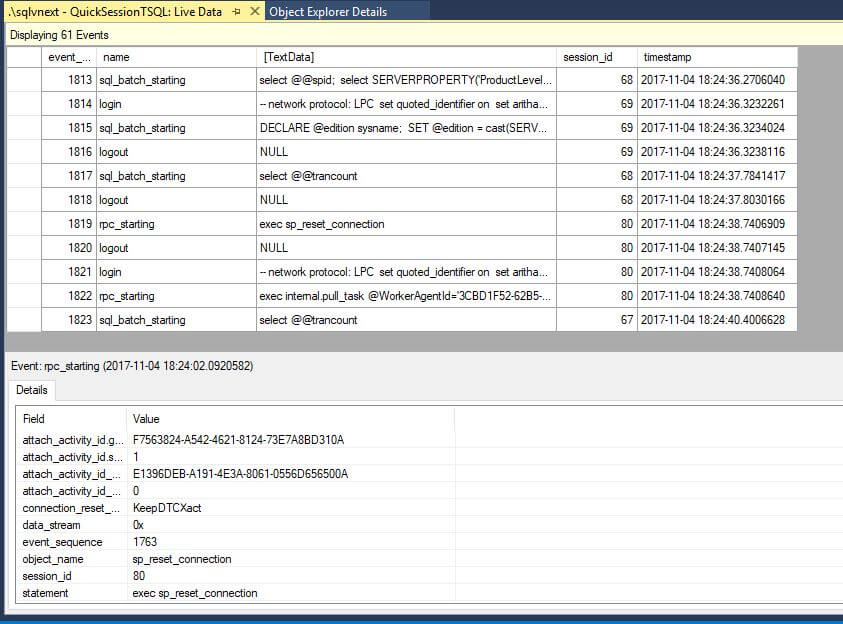
Similarly, if we launch TSQL XEvent Profiler, the default view looks as shown below.
By default a live data window shows the columns predefined, however, it is important to customize the view as per your requirements. It doesn’t show all columns by default.
To get more columns, right-click on any column and select Choose Columns.

It displays a list of columns that can be selected.

Move the desired columns to the right from the Available Columns to the Selected Columns and click OK.
Suppose I want database_id and logical_reads in my output, I move them to the right from Available Columns.
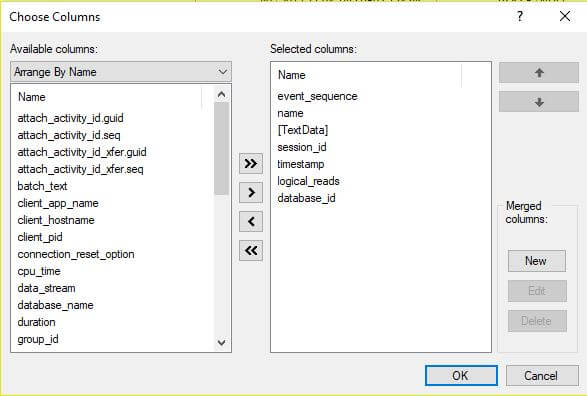
Now the output shows these columns and their values as well.

Merged Columns
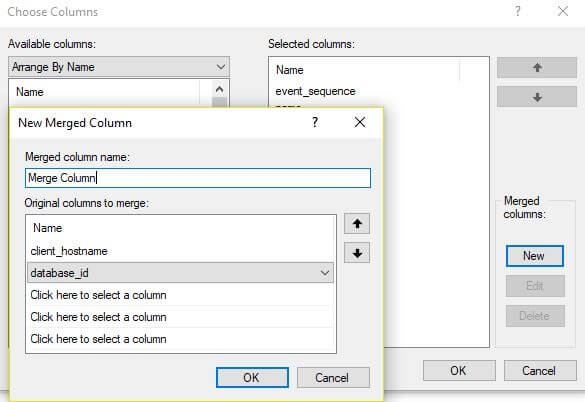
We can also create Merged columns by combining up to 5 columns. To do so, select New from the Merged columns section on the right.

We have to define a merged column name and select the columns from the drop-down that we want to use in the merged column.
Once defined, if we want to modify the Merged columns, click Edit.

Filters
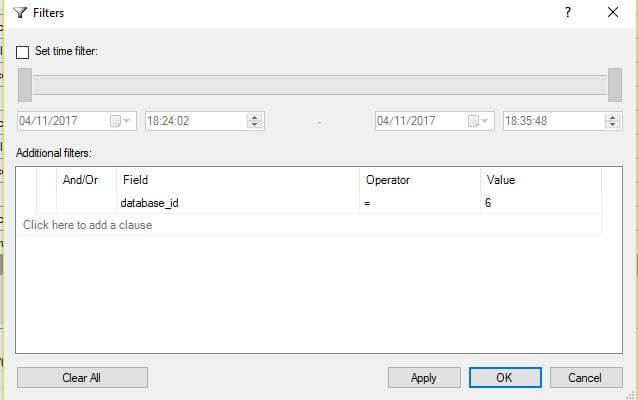
The live data wizard also provides options to Filter the results. Right click on a column and select Filter by this Value.
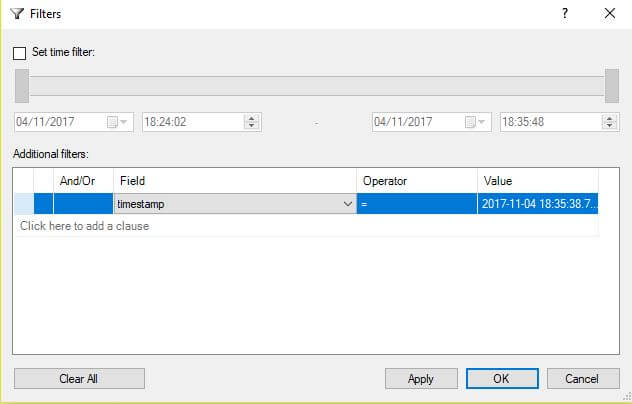
In this window, we can select a Filter based on the time range along with other filter values. Select the field from the drop-down and enter the search criteria. We can also put multiple conditions and put logical operation AND/OR to filter values. Here I want to filter all rows with database_id=6.
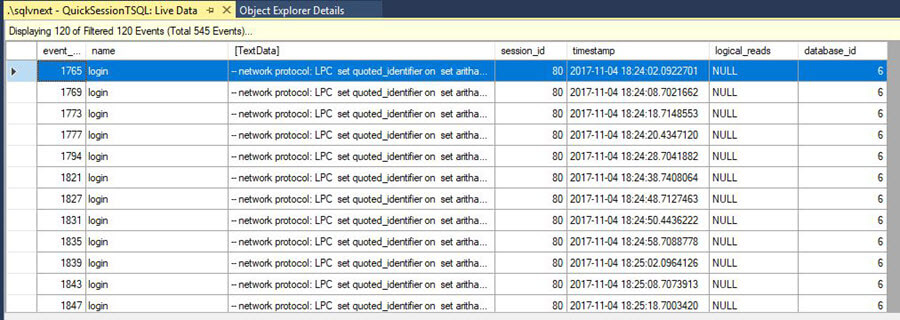
The results show the filtered values based on the filters we have defined.
Bookmarks
We can setup Bookmarks on statements which we want to review later using the “Toggle Bookmark” option from the Toolbar or Context menu. We can navigate between Bookmarks using the “Previous Bookmark” and “Next Bookmark” options. We can clear the Bookmarks using the “Clear All Bookmarks” option.
To bookmark a row, right click on the row and select Toggle Bookmark and it places a symbol on the row.

We can see the symbol for the bookmarked row to easily identify the row.
If we have multiple bookmarked rows, we can easily move to the previous and next rows by selecting the Previous Bookmark, Next Bookmark. Also, if we want to clear the bookmarked rows, click on Clear All Bookmarks.

XEvent Profiler allows starting a basic Extended Events Session quickly and easily. Explore this in your environment to make benefit out of it.
Next Steps
- Download and install SQL Server Management Studio v17.3.
- SQL Server 2017 officially launched on October 2nd, 2017. Check out the SQL Server 2017 Release notes.
- Explore SQL Server 2017 What’s new in SQL Server 2017
- Read more SQL Server 2017 tips
- Read more Extended Events tips

Hi! I am Rajendra Gupta, Database Specialist and Architect, helping organizations implement Microsoft SQL Server, Azure, Couchbase, AWS solutions fast and efficiently, fix related issues, and Performance Tuning with over 14 years of experience.
I am the author of the book “DP-300 Administering Relational Database on Microsoft Azure.” I can be reached at: Rajendra.gupta16@gmail.com for any consulting help.
- MSSQLTips Awards:
- Author of the Year – 2022 | Author Contender – 2021/2023/2024 | Champion Award (100+ tips) – 2020