By: Dinesh Asanka | Comments (2) | Related: > Extended Events
Problem
Monitoring is an essential aspect in any system and it is an important factor in SQL Server Analysis Services as well. Monitoring will help troubleshoot, audit operations and sometimes monitoring is needed to support various standards and legislation. SQL Server Analysis Services (SSAS) is an OLAP tool used for analysis of data and in many cases SSAS multidimensional cubes and tabular models contain data from many sources and therefore it might be essential to audit who is accessing what. Also, when there are performance issues in SSAS, monitoring needs to be enabled. This article discusses what options SQL Server provides to enable monitoring for SSAS.
Solution
SQL Profiler
SQL Profiler was the go-to tool for any kind of monitoring of SQL Server. Even for SSAS, SQL Profiler can be used similarly to the way it is used for the database engine as shown in the below image.
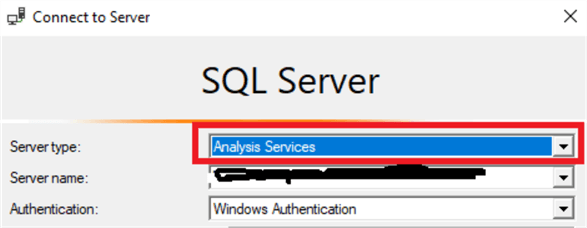
If you use Analysis Services for the Server type, you can monitor the SSAS server with SQL Profiler. After logging in with SQL Profiler, the next step is to provide the relevant events and necessary columns to capture data for the SSAS instance. Please note that a detail discussion on Profiler will not be done as this is not the focus of this article. Many users use SQL Profiler even though there are complaints that Profiler has caused performance issues to the cube. Due to this, many users are hesitant to use SQL Profiler, especially in a live environment as performance impacts are unavoidable.
Extended Events for SQL Server Analysis Services
Extended Events are a lightweight option to monitor SQL Server Database Engine and SQL Server Analysis Services. Extended Events were introduced in SQL Server 2008, but there was no user interface to configure them during the early releases. With SQL Server 2016, users have the capability of configuring Extended Events with a much easier user interface which makes this a better and easier option compared to SQL Profiler.
Configuring Extended Events Using SSMS
When logged in from SQL Server Management Studio (SSMS) to the SSAS instance (whether it is MDM or Tabular) you will see the option as shown below.
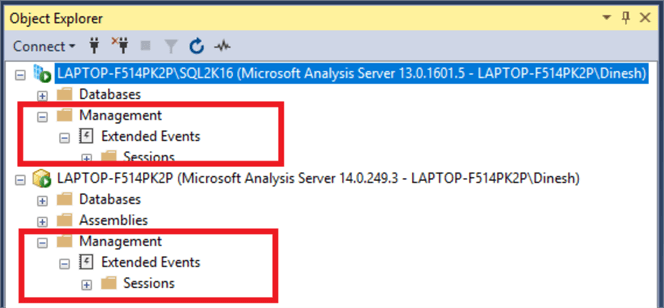
Please note that this article uses SSMS 17.6 as there is an error generated from SSMS 18.1 version at the time of writing this article.
By right-clicking the Sessions, you can invoke the creation of a new Extended Event session. There are four configuring options for Extended Events named: General, Events, Data Storage, Advanced.
In the General configuring option, you will get the following details.
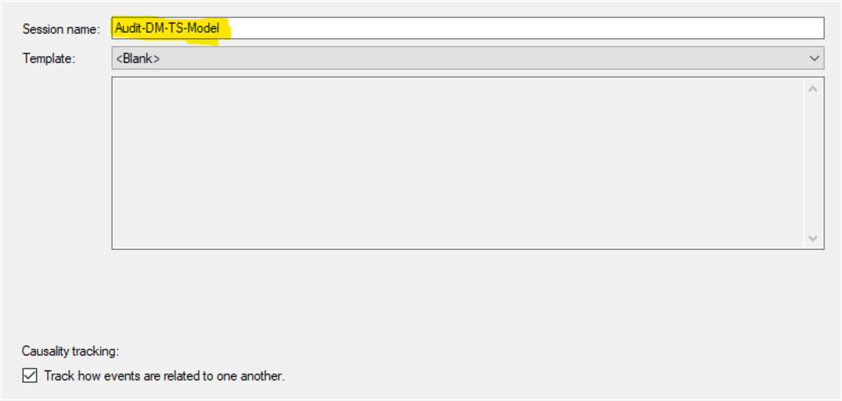
Session name can be entered and an Extended Event session can be created from a Template which will be discussed later. When you enable Causality Tracking for a session from the above checkbox, it will add a GUID and sequence number to every event, which you can then use to step through the order in which events occurred.
The next tab or the Event tab is the most important tab in the Extended Event configuration. In this tab, all the relevant events and their necessary fields are selected.
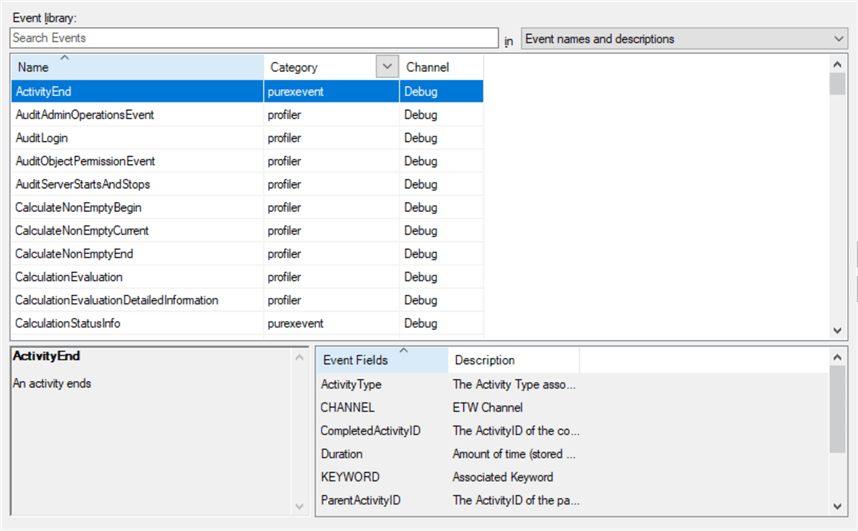
Events are triggered by various actions and it they have some corresponding fields. For example, the ActivityEnd event has ActivityType, Channel, CompletedActivityID, Duration, Keyword, ParentActivityId, RequestID, GlobalUniqueID and EventSchemaVersion fields.
There are two categories for events which are Purexevent and Profiler. Profiler events are the events which were available with SQL Profiler while purexevents are the events which are newly added with Extended Events.
Following are some events which are relevant to the SSAS service:
- DAXExtensionExecutionBegin
- DAXExtensionExecutionEnd
- DAXExtensionTraceError
- DAXExtensionTraceInfo
- DAXExtensionTraceVerbose
- ExecuteMDXScriptBegin
- ExecuteMDXScriptCurrent
- ExecuteMDXScriptEnd
- ExecuteMDXScriptError
- GetDataFromAggregation
- GetDataFromCache
- QueryCubeBegin
- QueryCubeEnd
- QueryDimension
- QuerySubcube
- QuerySubcubeVerbose
- TabularCommitRollbackFileDeleteFailed
- TabularDependencyGraph
- TabularFileDelete
- TabularFileRead
- TabularFileWrite
- TabularFolderDelete
- TabularJobGraph
- TabularLockGranted
- TabularLockWaiting
- TabularPersistDataObjectsCompleted
- TabularPrepareObject
- TabularSequencePointBegin
- TabularSequencePointEnd
- TabularTableLoadFailureDuringDatabaseDelete
- VertiPaqSEQueryBegin
- VertiPaqSEQueryCacheMatch
- VertiPaqSEQueryEnd
Once events are selected, next is to choose the necessary fields for each event.
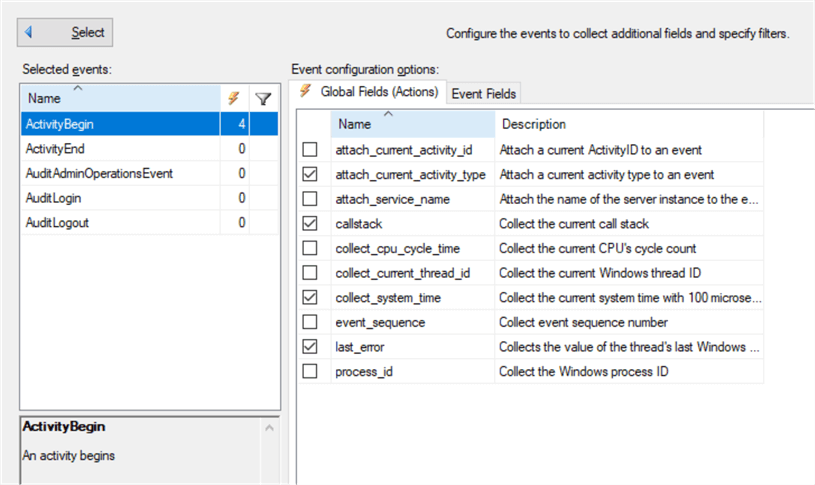
For each event, there are two types of fields such as Global fields and Event fields. All Event fields will be selected for the events and you can choose necessary global fields from the given list.
Next is to save the Extended Event's details to the required storage. You have multiple options to store the Extended Events data. There are three types of storage options such as event_file, event_stream, and ring buffer.
Following is the configuration for event_file.
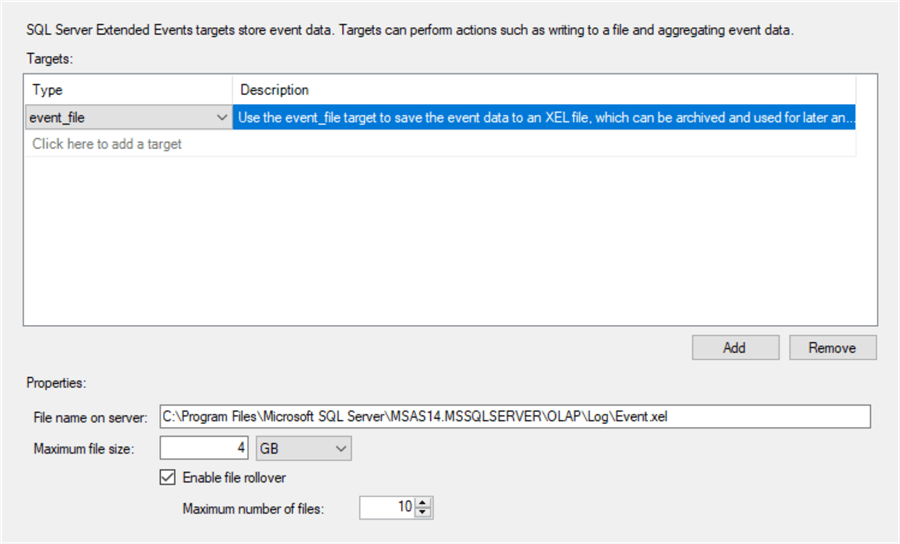
With this option, data is written to the file. However, unlike other troubleshooting tools, writing does not happen directly to the file. Instead, it will first write to memory and periodically as an asynchronous process, the file will be updated. Due to this approach, the impact of writing to the file is much less. You can export this file to a SQL Server table or to a CSV file for better visualization and manageability.
The event stream is asynchronous from which live data can be viewed from the SSMS.
Ring_buffer is another option to store Extended Events.
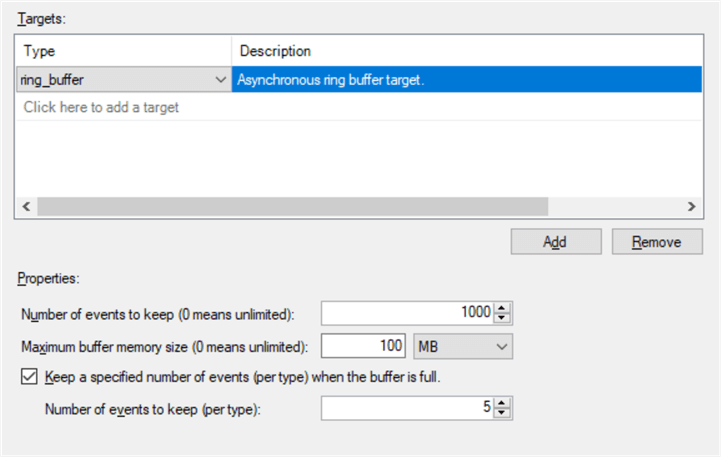
The ring buffer target holds event data in memory for a short time period. This target can manage events in two modes.
In one mode, a limited number of events or memory size will be maintained as a FIFO model. In the second model, FIFO is maintained per event. In this mode, the oldest events of each type are discarded when all memory is allocated.
Viewing Extended Events
When the Extended Event is saved in the ring_buffer option, you can view it from SSMS by right-clicking and selecting the Watch Live Data option.
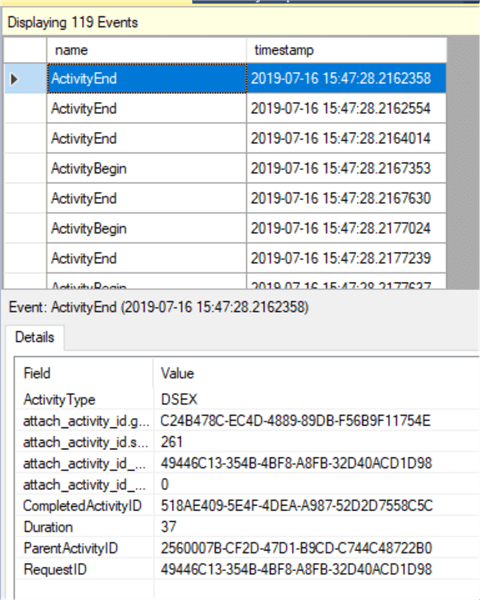
Events are displayed in the upper screen and you can get the details of the event from the bottom part.
Templates for Extended Events
Unlike SQL Profiler, there is only one template available for Extended Events for SSAS which is shown below.
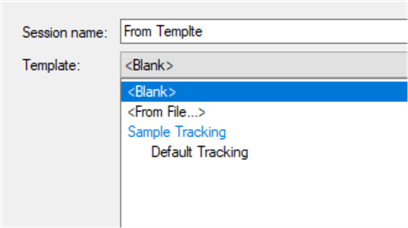
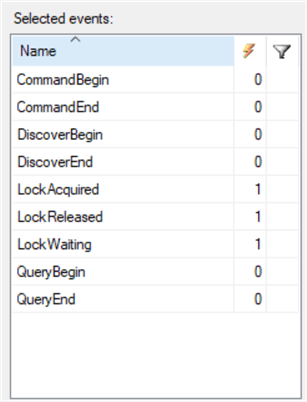
This template will select the following events.
Next Steps
- Extended Events are available for SQL Server Multidimensional OLAP, Tabular and more importantly for Azure Analysis Services. On a side note, Extended Events is not available for Azure Data Warehouse services.
- Extended Events is not available for SQL Server Reporting Services and SQL Server Integration Services.
- Perfmon and DMVs can also be used to monitor SSAS, but they have limited features for monitoring.
- Check out the Extended Events tutorial.
About the author
 Dinesh Asanka is a 10 time Data Platform MVP and frequent speaker at local and international conferences with more than 12 years of database experience.
This author pledges the content of this article is based on professional experience and not AI generated.
View all my tips


