By: Rajendra Gupta | Comments | Related: > Extended Events
Problem
SQL Server 2012 Management Studio included a graphical user interface to configure and manage Extended Events within the SQL Server database engine, but it was not available for Analysis Services. So in this tip we will see how we can use the GUI features in SQL Server 2016 Management Studio to configure and manage Extended Events for Analysis Services.
Solution
As per MSDN - Extended Events (xEvents) are a light-weight tracing and performance monitoring system that uses very few system resources, making it an ideal tool for diagnosing problems on both production and test servers. It's also highly scalable, configurable, and in SQL Server 2016 CTP 2.3, easier to use through new built-in tool support with SQL Server Management Studio. In SQL Server Management Studio, for connections to Analysis Services instances, you can configure, run, and monitor a live trace, similar to using SQL Server Profiler. The addition of better tooling should make Extended Events a more reasonable replacement for SQL Server Profiler and creates more symmetry in how you diagnose issues in your database engine and Analysis Services workloads.
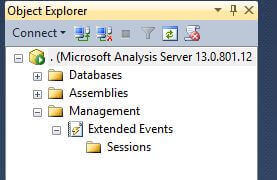
If we connect to Management Studio in SQL Server 2016 we can see the "Management" folder under the server object within Object Explorer
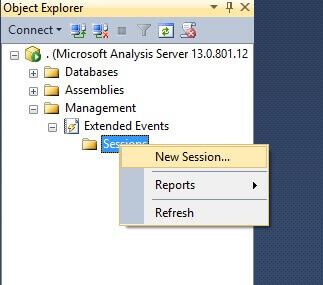
To create and configure Extended event right click on the "Sessions" folder and select the "New Session..." option.
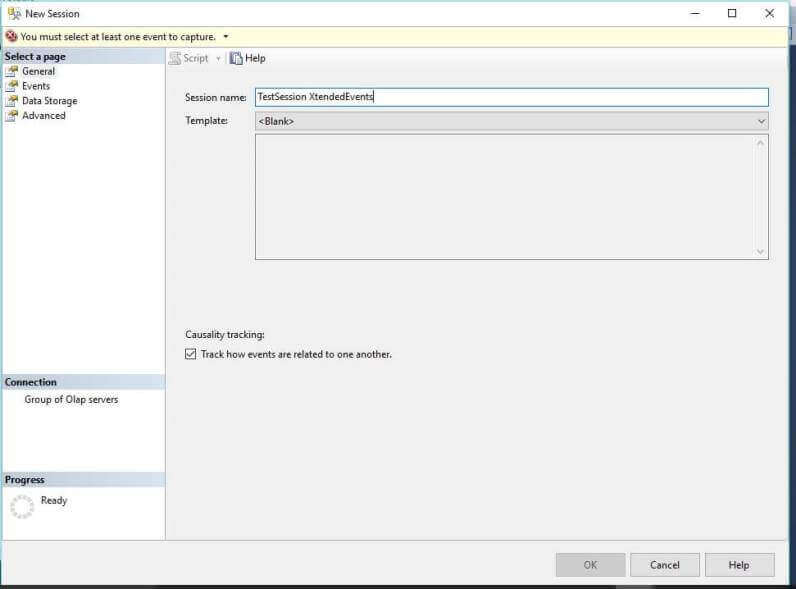
This loads the New Session interface to begin creating and managing Extended Events. Start off by entering the "Session name".
Now click on the "Events" page in the left navigation to see all the events available.
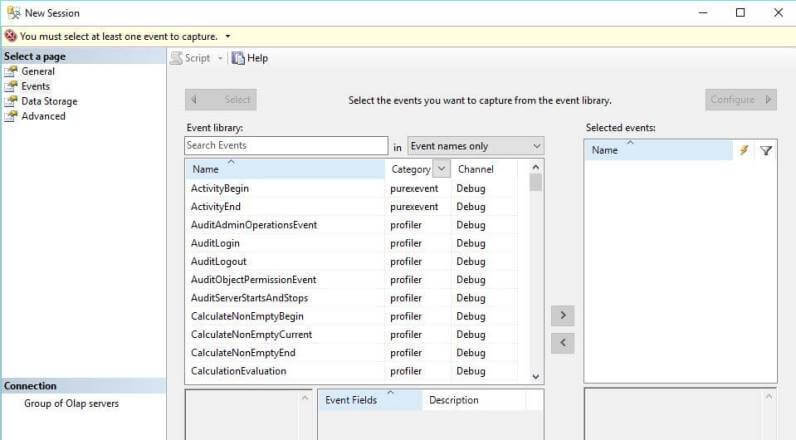
On the Events tab, we can select the events that you want to capture. You can also search for specific events you want to capture. Two types of Events are available Profiler and PureXEvent.
Profiler Events are the same as was available in Profiler while the PureXEvent as its name suggests it is purely new to Extended Events.
One good item here is that the interface shows the Description of the events and also provides in-line search functionality i.e. if we type any keyword it will search for the keyword in the available values as shown below.
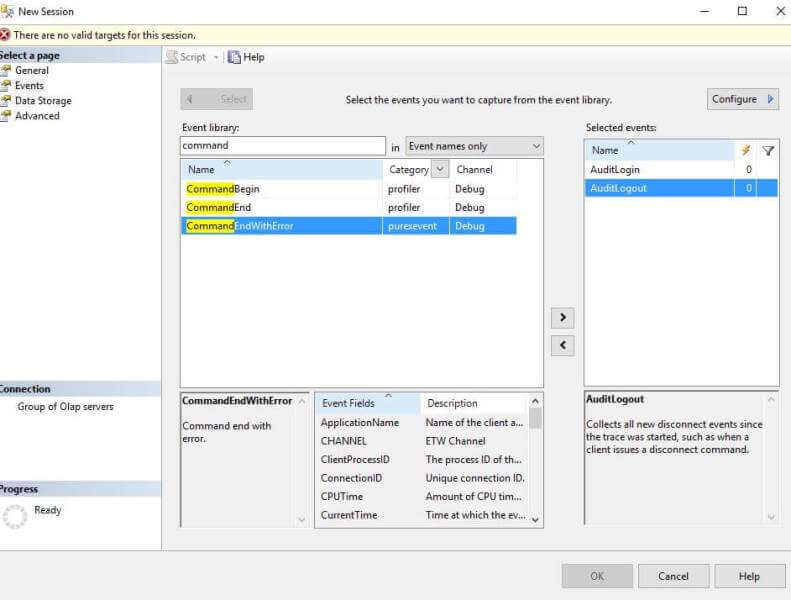
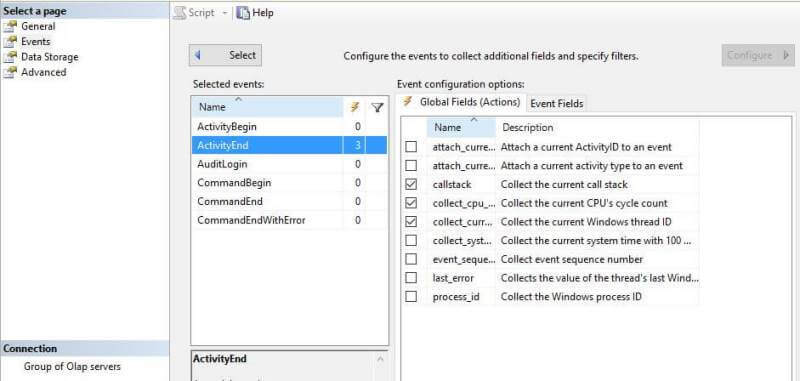
Once we have selected which events we want to capture we need to configure them by clicking on the "Configure" button on the top right of the same window. By clicking on the "Configure" button we can select the fields we want to capture. These are broken up into Global fields that occur on every event, as well as fields that are specific to that event.
Here are the Global Fields:
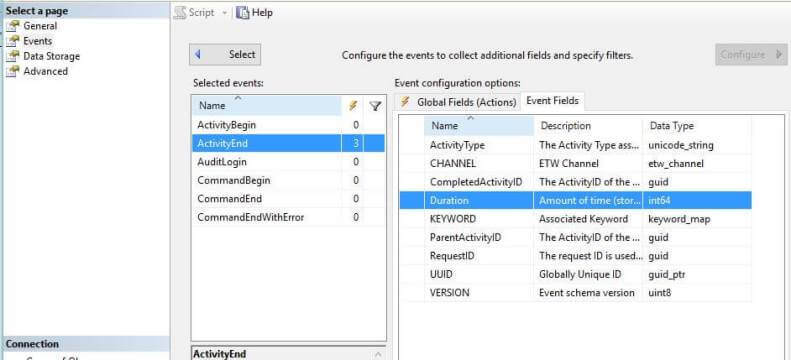
Here are the Event Fields:
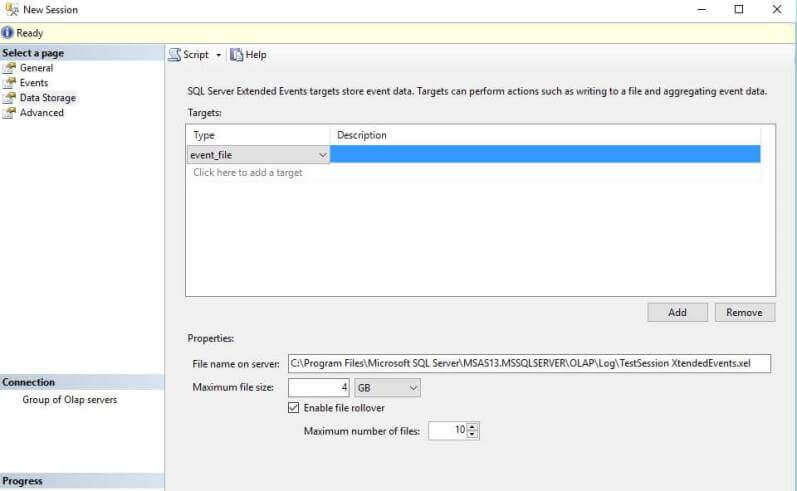
Now click on Data Storage Tabs which allows you to specify the targets as event_file, event_stream or ring_buffer.
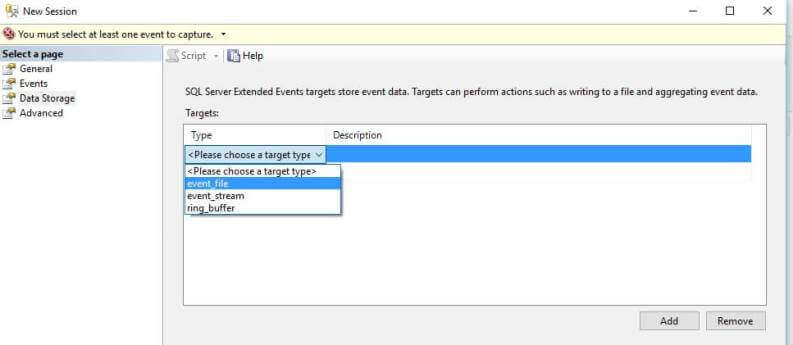
Here is an explanation of each option:
- event_file stores session data in an .xel file.
- event_stream enables the Watch Live Data option in Management Studio.
- ring_buffer stores session data in memory for as long as the server is running. On a server restart, the session data is thrown out.
If we want to store the event session in a file we need to specify a path.
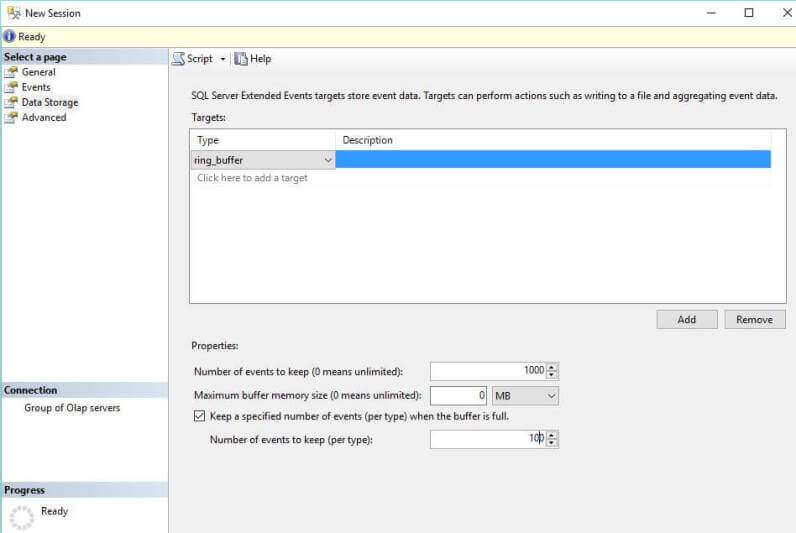
While if we use the Ring_Buffer to save the data it gives an additional option to set.
On the last page in the left navigation, click on the Advanced tab to see more properties and to set options for the Extended Event session.
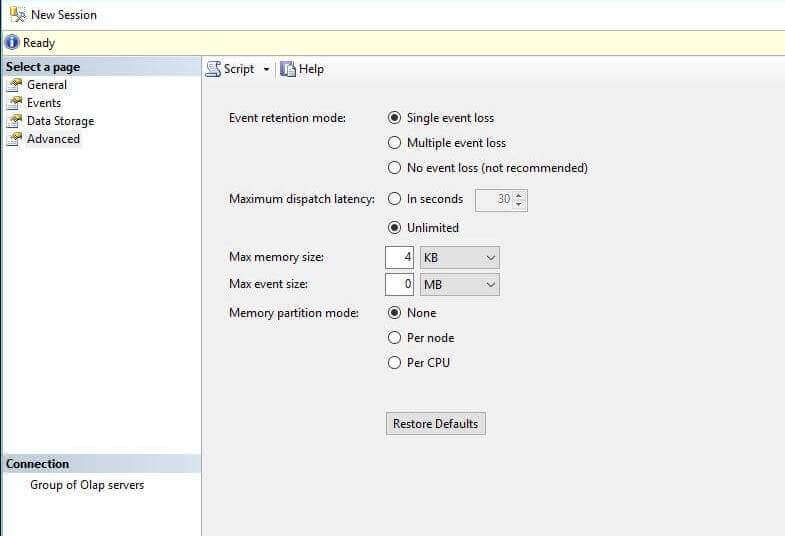
Here is an explanation for these options on the Advanced tab of the Extended Events interface:
- Event Retention mode: This is how we want our events to be handled. Suppose in
the case of a heavily loaded system, this option ensures we want to capture all events or is it fine to lose some events while keeping system performance and reliability intact.
- The event retention mode is set to “Single event loss”. This means if the event buffers fill up before SQL Server can write the events to the targets, it will drop a single event instead of causing significant performance degradation on the server.
- If we set this option to "No event loss" this option may impact system performance so care should be taken.
- Maximum Dispatch latency: This option forces events to be flushed from memory to the targets at a defined interval.
- In seconds. Select this option to prolong or shorten the maximum dispatch latency.
- Unlimited. Select this option if you want the events dispatched only when the buffer is full.
- The final option includes:
- Maximum memory size
- Maximum event size
- Memory partition mode which is how the memory partition should be handled i.e. none, per node or per CPU.
As a final option, we can script out our actions by clicking on the "Script" option on top navigation. Here is sample output as a point of reference:
<Create xmlns="http://schemas.microsoft.com/analysisservices/2003/engine">
  <ObjectDefinition>
    <Trace>
      <ID>TestSession XtendedEvents<ID/>
      <Name>TestSession XtendedEvents<Name/>
      <XEvent xmlns="http://schemas.microsoft.com/analysisservices/2011/engine/300/300"/>
        <event_session name="TestSession XtendedEvents" dispatchLatency="0" maxEventSize="0"
		maxMemory="4" memoryPartition="none" eventRetentionMode="AllowSingleEventLoss" trackCausality="true" xmlns="http://schemas.microsoft.com/analysisservices/2003/engine"/>
          <event package="AS" name="CommandBegin" />
          <event package="AS" name="CommandEnd" />
          <event package="AS" name="CommandEndWithError" />
          <event package="AS" name="AuditLogin" />
          <event package="AS" name="ActivityBegin" />
          <event package="AS" name="ActivityEnd"/>
            <action package="package0" name="callstack" />
            <action package="package0" name="collect_cpu_cycle_time" />
            <action package="package0" name="collect_current_thread_id"/>
          </event>
          <target package="package0" name="event_file"/>
            <parameter name="filename"
			value="C:\Program Files\Microsoft SQL Server\MSAS13.MSSQLSERVER\OLAP\Log\TestSession XtendedEvents.xel" />
            <parameter name="max_file_size" value="4096" />
            <parameter name="max_rollover_files" value="10" />
            <parameter name="increment" value="1024" />
          <target/>
        <event_session/>
      <XEvent/>
    <Trace/>
  <ObjectDefinition/>
</Create>
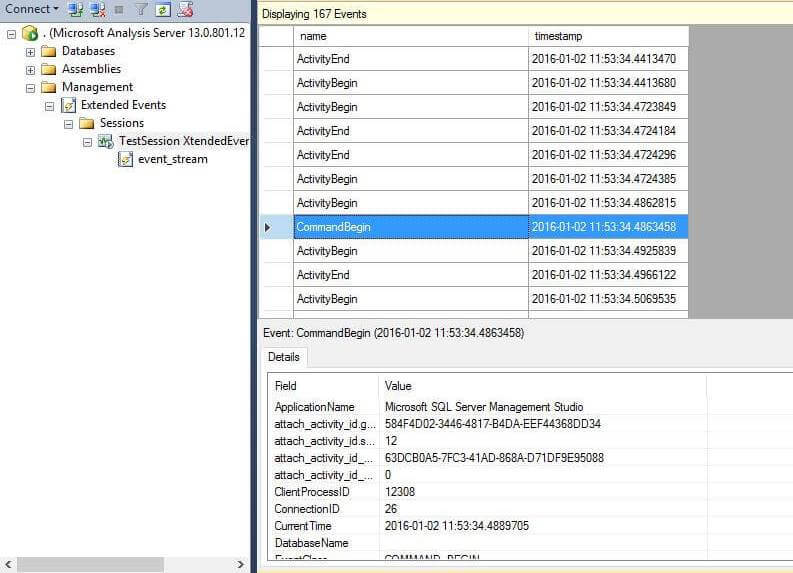
When we configured the Extended Events, if we selected the option to show live data after configuration we can navigate to the newly created event, right click on the event and select the "Watch Live Data" as shown below.
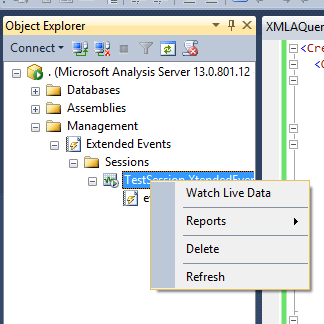
Here is sample output from the "Watch Live Data" option:
Next Steps
- As you begin to adopt SQL Server 2016 be sure to keep in mind the new opportunities with Extended Events as well as the new functionality outlined in these SQL Server 2016 tips.
- Check out these additional resources:
- Read more about Monitor Analysis Services using Extended Events.
- SQL Server Profiler tips
- SQL Server Extended Events tips
- SQL Server Analysis Services tips


About the author
 Rajendra Gupta is a Consultant DBA with 14+ years of extensive experience in database administration including large critical OLAP, OLTP, Reporting and SharePoint databases.
This author pledges the content of this article is based on professional experience and not AI generated.
View all my tips
