Display Graphics Dynamically in SQL Server Reporting Services

By:   |   Comments (15)   |   Related: > Reporting Services Dynamic Reports


Problem
Sometimes having just numbers and tables on a report is not enough.   Wouldn't it be much easier to spot trouble issues on reports based on color coding or specific images?  In this tip we will explore how to display specific graphics based on specific data content.  Instead of just showing the data now you can have images highlight certain data elements too.  Take a look at this tip to find out how.


Solution
The first part of this tip will demonstrate how to add a graphics to your report using an external web reference.  The second part will show how to add graphics to your project, in the actual data table, and then dynamically changing them based on data content.


Preparation

Step 1 - Add Some Sample Data

First, we'll need a little sample data to play with. In a test database, run the following script in a query window from the SQL Server Management Console.

-- MAKE SURE you do NOT run this in any production or system database
--uncomment the next line and replace the word "testdatabase' with the name of your database.
--USE testdatabase


SET ANSI_NULLS ON
GO
SET QUOTED_IDENTIFIER ON
GO
CREATE TABLE [dbo].[GraphicsProjects1](
    [ProjectID] [int] IDENTITY(1,1) NOT NULL,
    [ProjectCode] [nvarchar](50) NULL,
    [ProjectDesc] [nvarchar](max) NULL,
    [ProjectOwner] [nvarchar](50) NULL,
    [ProjectDueDate] [datetime] NULL,
    [ProjectStatus] [nvarchar](50) NULL)

INSERT INTO GraphicsProjects1 ([ProjectCode] , [ProjectDesc] , [ProjectOwner] , [ProjectDueDate] , [ProjectStatus] )
Values ('A1' , 'Demo dynamic graphics' , 'John' , '10/31/2007 12:0:0 AM' , 'green' ) ;

INSERT INTO GraphicsProjects1 ([ProjectCode] , [ProjectDesc] , [ProjectOwner] , [ProjectDueDate] , [ProjectStatus] )
Values ('A2' , 'Billboard project' , 'Bill' , '11/15/2007 12:0:0 AM' , 'yellow' ) ;

INSERT INTO GraphicsProjects1 ([ProjectCode] , [ProjectDesc] , [ProjectOwner] , [ProjectDueDate] , [ProjectStatus] )
Values ('A3' , 'Magazine layout' , 'Alice' , '12/24/2007 12:0:0 AM' , 'red' ) ;

INSERT INTO GraphicsProjects1 ([ProjectCode] , [ProjectDesc] , [ProjectOwner] , [ProjectDueDate] , [ProjectStatus] )
Values ('B1' , 'Sandbox decorating' , 'Sally' , '7/4/2008 12:0:0 AM' , 'green' ) ;


This will add a table called GraphicsProjects1 to your test database. It contains 4 rows with simple information about various fictional projects.

Step 2 - Create a new Reporting Service project solution using the Business Intelligence Development Studio and follow the steps below.
  • In the new project, create a datasource connecting to the database where you created your new sample data (from Step 1).
  • Create a new report.
  • In the report, create a new dataset using the datasource you just created.
In the dataset, use the following query:
SELECT        ProjectID, ProjectCode, ProjectDesc, ProjectOwner, ProjectDueDate, ProjectStatus
FROM            GraphicsProjects1


Part 1 - Adding a static graphic to your report using an external web reference

  • On the layout section of your report, add a textbox by dragging the textbox object from the toolbox.

textbox

  • Inside the text box, enter Project Manager.

  • Then, drag the image object from the toolbox to a spot just below the Project Manager textbox. This will start the Image Wizard.

WelcomeImageWizard
  • Click Next.

  • On the Select the Image Source page of the wizard, choose the Web option and click Next.
  • On the next page, enter the following for the URL:
    http://www.mssqltips.com/images/RobFisch.JPG


SpecifyURL

  • Click Finish, on the Completing the Wizard page.
When you are done, your layout should look like this:

layout1

Let's do one more thing just for fun.
  • Right-click on the image and select Properties. 
  • Click on the navigation tab and select the Jump to URL radio button.
  • Enter the following in the field:
    http://www.mssqltips.com/author.asp?authorid=3
  • Save your work and preview the report.
You have just completed part 1 of this demonstration. You used the image object from the toolbox using an external web reference. Now on to the fun stuff...


Part 2 - Adding dynamic graphics based on data

Preparation

Download each of these images to a temporary folder on your computer. (Right-click and select Save Picture As for each one.)
traffic light green traffic light yellow traffic light red
Note: These images were taken from http://www.wpclipart.com. They post them as Public Domain images.

  • Add a table to the layout just below the picture.
  • Create 7 columns. (Each column should be about 1" wide.)
  • Add each of the data columns from the dataset, leaving the last column blank for now. The table should look like this:
table

  • Format the borderstyle for all textboxes in the table Solid. Font size 8.
  • Add an image object to the last column. This time choose Project as the image source.
ProjectGraphic

  • On the Choose the Image from the Project page, click the New Image button.
  • Navigate to the folder on your computer where you saved the traffic light images. Choose the green traffic light image.
  • Click the New Image button again.
  • Choose the yellow traffic light.
  • Repeat again and choose the red traffic light. The page should look like this:
trafficlights

  • Click Next and then Finish.
sizing
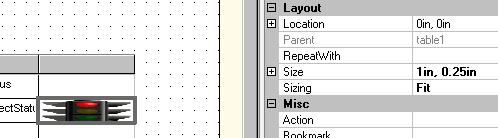
  • Select the graphic and then find the Sizing property. Change it from Fit to FitProportional.
  • In the Value property, enter one the following expressions below:

=SWITCH(Fields!ProjectStatus.Value="red","traffic_light_red.png",
        Fields!ProjectStatus.Value="yellow","traffic_light_yellow.png",
        Fields!ProjectStatus.Value="green","traffic_light_green.png")

OR

=IIF(Fields!ProjectStatus.Value="red","traffic_light_red.png",
          IIF(Fields!ProjectStatus.Value="yellow","traffic_light_yellow.png",
                   IIF(Fields!ProjectStatus.Value="green","traffic_light_green.png",nothing
                      )
              )
     )


  • Save your work.
  • Deploy the report to the Report Server.
  • IMPORTANT: You MUST also deploy the images. You should see them in your Solution Explorer along with your report.
Your deployed table should like like this:

report

In contrast to the first part of this tip, where we referenced an external image, this part uses several Project images that are stored on the reporting server with your reports. You could also have used the external web reference with this technique.


Next Steps
  • Look up the IIF() and SWITCH() functions in BooksOnLine.
  • Try adding tooltips to your images.
  • Take a look at these other Reporting Services tips.


sql server categories

sql server webinars

subscribe to mssqltips

sql server tutorials

sql server white papers

next tip


About the author
MSSQLTips author Rob Fisch Rob Fisch has worked with SQL Server since version 6.5 as a dba, developer, report writer and data warehouse designer.

This author pledges the content of this article is based on professional experience and not AI generated.

View all my tips


Comments For This Article


Thursday, March 6, 2014 - 10:49:59 AM - Maiyana Back To Top (29658)
HI Thank you for your time for this tutorial, Its very useful, I used ssrs 2008 report. How can i get the image wizard? i create the report kind of the certification for the trophycatch. the image will show base on species of the fish and we have 33 species. 
Thank you


Wednesday, January 22, 2014 - 7:58:54 AM - TYVM Back To Top (28171)

For SQL Server 2008 the steps are a little different but I got it to work. Thank you very much for this great example :-)


Tuesday, January 8, 2013 - 6:33:10 PM - CK Back To Top (21325)

For Visual Studio 2008, you can add multiple images to the "Images" folder, just above the DataSources folder, on the left panel of your your report. Then grap the Image icon from the Toolbox to the proper cell. After that Right Click|Iamge Property|Embedded|fx. As Ludan stated above, no .png for SSRS 2008.


Thursday, January 20, 2011 - 9:03:44 AM - Rob Fisch Back To Top (12645)

Saint, the article was written for SSRS 2005. In SSRS 2008, a similar option exists, but it is called "Action".


Thursday, January 20, 2011 - 3:49:37 AM - Saint Back To Top (12643)

Hello!

I followed along and had good report until I got adding image as regard the traffic set of lights. SSRS 2008 doesn't have a navigation button like it was said.So I only was able to load a single light - green.

Can anyone pls tell how to take it from there?

Thanks


Tuesday, February 2, 2010 - 10:13:31 AM - Ludan Back To Top (4838)

if is sql 2005 then your code is:
=SWITCH(Fields!status.Value="Passed","image_pass.jpg",
Fields!status.Value="Failed","caution.jpg")

greetings


Tuesday, February 2, 2010 - 2:05:57 AM - bob_adlin Back To Top (4833)

hi..i have followed your advice:

=SWITCH(Fields!status.Value="Passed","image_pass",

Fields!status.Value="Failed","caution")

but somehow..still the images wouldnt appear..only showing "X"...even when I used IIF statement..same thing happened...fyi both are (*.jpg)

could you please help....


Thursday, January 28, 2010 - 8:56:03 AM - Ludan Back To Top (4813)

in case of sql server 2008 the graphics are aggregate in the folder images in the tab report data and the query change to

=SWITCH(Fields!ProjectStatus.Value="red","traffic_light_red",
        Fields!ProjectStatus.Value="yellow","traffic_light_yellow",
        Fields!ProjectStatus.Value="green","traffic_light_green")

be sure not to put the extension(jpg, png, etc) to graphics files (in the switch statement)


in case of sql server 2005 the query change

=SWITCH(Fields!ProjectStatus.Value="red","traffic_light_red.png",
        Fields!ProjectStatus.Value="yellow","traffic_light_yellow.png",
        Fields!ProjectStatus.Value="green","traffic_light_green.png")

greetings

Thursday, January 28, 2010 - 8:51:05 AM - Ludan Back To Top (4812)

be sure not to put the extension (.jpg, .png, etc) to graphics files (in the switch statement)


Wednesday, January 27, 2010 - 11:19:11 PM - bob_adlin Back To Top (4808)

and ludan,

by the way im using MS SQL Server 2005(32bit) + reporting services..

as for your tips, I've used both IIF and SWITCH to manipulate my codes, but seems like both were failed to show any images


Wednesday, January 27, 2010 - 11:16:07 PM - bob_adlin Back To Top (4807)

hi Ludan..

thanks for your tips given..yes I managed to do as what you told me to..

but when I run the report, the image doesnt show at all..end up all images shown as "x"..

seems like it couldnt read or the path not correct..

Could you please advice, what should I do next?

Thanks


Monday, January 25, 2010 - 5:11:02 PM - Ludan Back To Top (4786)

in case of sql server 2008 the graphics are aggregate in the folder images in the tab report data and the query change of

=SWITCH(Fields!ProjectStatus.Value="red","traffic_light_red.png",
        Fields!ProjectStatus.Value="yellow","traffic_light_yellow.png",
        Fields!ProjectStatus.Value="green","traffic_light_green.png")

 to

=SWITCH(Fields!ProjectStatus.Value="red","traffic_light_red",
        Fields!ProjectStatus.Value="yellow","traffic_light_yellow",
        Fields!ProjectStatus.Value="green","traffic_light_green")

greetings and sorry for the traduction :) 


Friday, July 10, 2009 - 1:40:35 AM - jcnovoa Back To Top (3718)

Load an external image first (any image), and adjust it accordingly via design mode... or just add a label, and then find that label in the code behind (xml of the rdl file - right click on rdl, select view code) and replace that label with the code in my previous post.

J. C.


Thursday, July 9, 2009 - 9:59:42 AM - Jay Patel Back To Top (3715)

I am using Visual Studio 2005 and following your tips. I do not see the properties you have mentioned in your tips. Like sizing the image, value property once I add the image to the table column.

Any idea why I do not see these properties?

Thanks

Jay 


Monday, January 7, 2008 - 2:01:22 PM - jcnovoa Back To Top (201)

One thing I’ve noticed when the reporting services report server is under a different domain or even website from the hosting application (where the images are loaded from),  the images may not render due to session state/cookies being set on the report server’s IP, while the report is hosted from within a ASPX page in a different domain/website. Is good to know that you can load images into the actual report server directory where the report is rendered from and add a reference to the image within the report folder, and perhaps dynamically change the image based on the data

<ReportItems>                   
<Image Name="image1">                     
<Sizing>Fit</Sizing>
                     
<MIMEType />
                     
<ZIndex>6</ZIndex>
                     
<Source>External</Source>
                     
<Style>
                       
<BorderStyle>
                         
<Default>Solid</Default>
                       
</BorderStyle>
                       
<BorderColor>
                          
<Default>LightGrey</Default>
                       
</BorderColor>
                     
</Style>
                     
<Value>="CompanyLogo_" &amp;  Fields!CompanyNumber.Value  &amp; ".jpg"</Value>
                   
</Image>
</ReportItems>


get free sql tips
agree to terms