Built in Time Dimension and Time Intelligence in SQL Server Analysis

By:   |   Comments (23)   |   Related: > Analysis Services Dimensions


Problem

We are building an Analysis Services cube and trying to understand how to create a time dimension and take advantage of the built-in time intelligence features that provide many useful calculations such as period-to-date, period-over-period growth, etc.  Can you provide a detailed explanation of how it all works?

Solution

Getting the time dimension configured correctly is a necessary first step in order to take advantage of the Time Intelligence features in SSAS which support the various queries that you mention.  Just about every data warehouse and cube has a time dimension which represents the hierarchies that you use to filter your queries such as year, month and quarter.  The dimension names time, date, calendar, etc. are generally used interchangeably.  My naming preference is calendar because that's really what you're modeling in most cases and the name easily supports multiple calendars like fiscal year, reporting year, etc. 

Probably the best way to understand how the SSAS built-in features for the time dimension work is to walk through an example.  When you create an SSAS cube you have the option of building it from an existing data source or without using a data source.  In the latter case the SSAS Cube Wizard can generate the relational schema that you need to populate the cube.  This option comes in handy when you're trying to design your cube as the to-be solution; i.e. this is what I want versus creating a cube from an existing data source; i.e. this is what I have and let's use it to create a cube.  Another advantage of creating the cube without a data source is that the important properties for configuring the time dimension get set for you automatically.

Let's walk through the steps to build a cube that uses the built-in SSAS features for the time dimension and associated time intelligence.  The starting point is to create an SSAS project in Business Intelligence Developer Studio (BIDS) or Visual Studio.

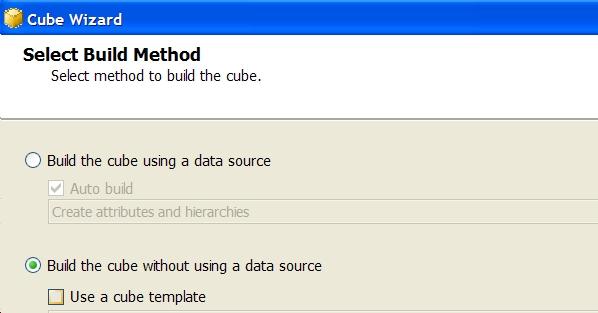
After creating the SSAS project, right click on Cubes in the Solution Explorer and select New Cube to launch the Cube Wizard.  On the Select Build Method dialog select Build the cube without using a data source.  This allows us to create a cube and generate the relational schema that will be used to populate the cube. 

cube wizard

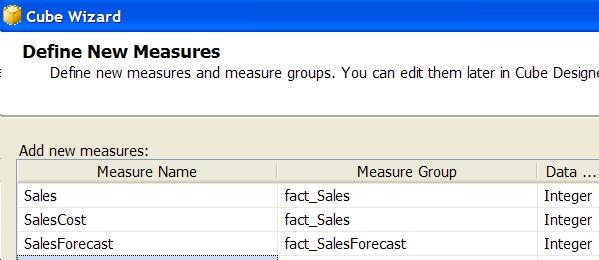
Define a couple of measures.  Measures are typically the dollar amounts that are monitored to determine how your business is performing.  When the relational schema is generated, a table is created for each Measure Group; a column in the table is created for each Measure Name. 

define new measures

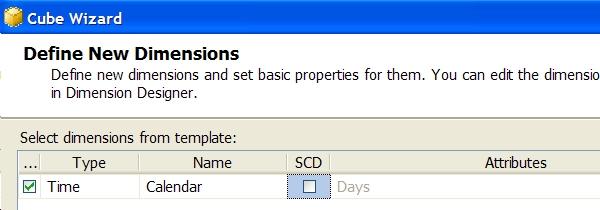
The Define New Dimensions dialog allows us to define dimensions for the cube.  Dimensions are the attributes that we use to slice and dice the data.  For our example we'll just create a time dimension.  Check the Time type and enter the name Calendar.  When the relational schema is generated, a table called Calendar will be created.

define new dimensions

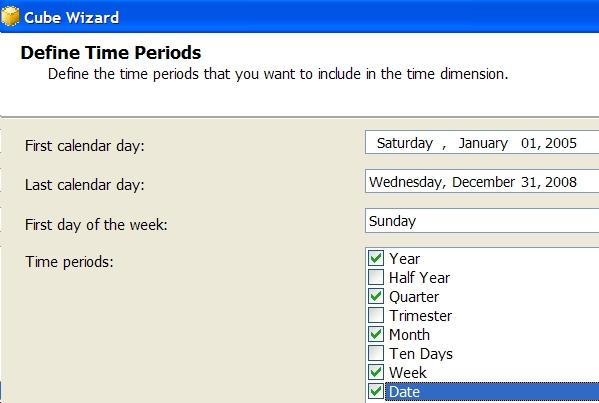
After selecting a Time-type dimension, you define the date range and the time periods.  When the relational schema is generated, the time dimension will be populated automatically based on the selections below.  The time periods allow us to perform queries that filter the measures by year, quarter, month, week or day.  You also have the option to define a Fiscal Calendar, Reporting Calendar, etc. (this step is skipped in our example).

define time periods

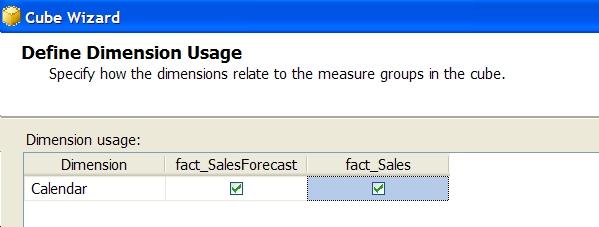
The Define Dimension Usage dialog allows us to link the measures to the respective dimensions.  When the relational schema is generated, there will be a foreign key in each measure group table enabling a join to the dimension table.

define dimension usage

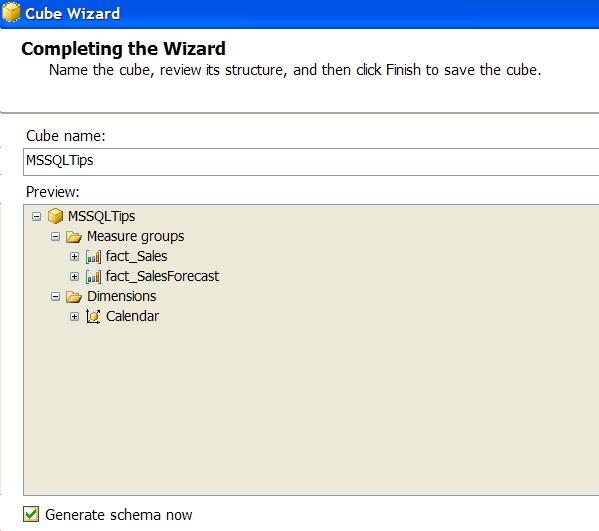
The final dialog in the Cube Wizard summarizes the selections made and allows you to name the cube.  Click the Generate schema now checkbox; this generates the relational schema that will be used to populate the cube.

mssqltips

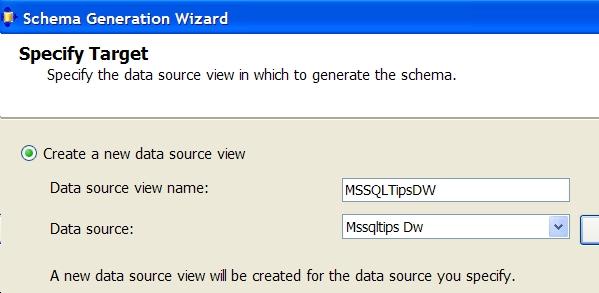
When you check Generate schema now the Schema Generation Wizard is launched to guide you through the steps to generate the relational schema.  The Specify Target dialog is used to identify the database where the relational schema will be generated.  The Data source identifies the database; the Data source view is used to specify the tables, views, etc. from one of more data sources that will be used to populate the cube.  The cube is always built from the data source view.  Prior to this step you may want to create a new database to use as the data source.

specify target

For the remainder of the steps in the Schema Generation Wizard just accept the defaults.  After the schema is generated, the cube needs to be processed.  Right click on the cube in the Solution Explorer and select Process.

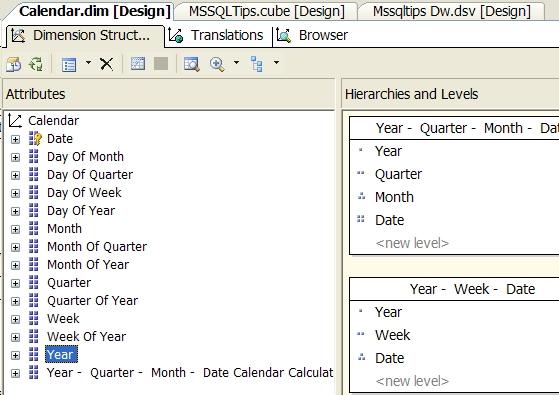
Let's review a few key points about the time dimension that was automatically created for us.  Double click Calendar.dim under Dimensions in the Solution Explorer to review the dimension structure which shows the attributes and hierarchies.  Two hierarchies have been created with the levels as shown.  These hierarchies allow us to summarize and drill through the measures in the cube.

dimension

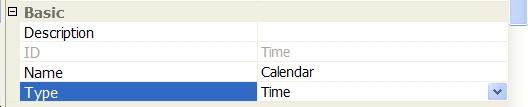
Click on Calendar (first entry under Attributes above) to display the dimension properties.  The Type property (in the Basic group in the Properties window) has the value of Time which designates it as a Time dimension.  If you click on the dropdown for the Type attribute, you will see that there are many other types of dimensions that have some sort of built-in support in SSAS.

type

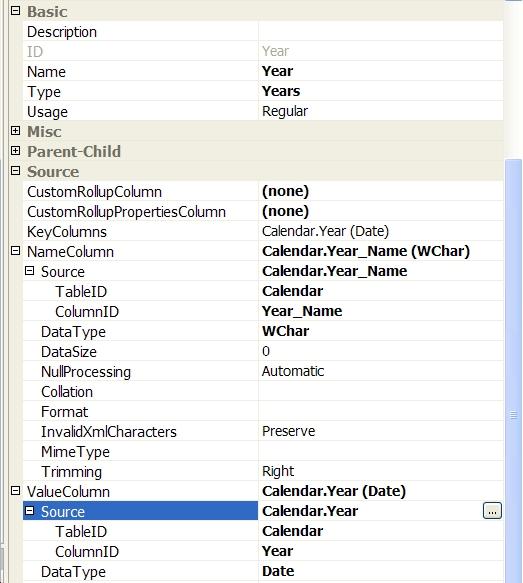
For an individual attribute, there are several properties that must be set correctly as well.  As an example click on the Year attribute to view its pertinent properties.  The Type property must be set to Years.  The Name column specifies the column in the generated relational schema that is used as the display name for the attribute ; note that it is a WChar type which is a string.  The ValueColumn represents the underlying value of the attribute and it is a Date type.  You can browse the other attributes and note their property settings.  A key advantage to generating the time dimension in the Cube Wizard is that all of the important properties get set correctly for you automatically.

year

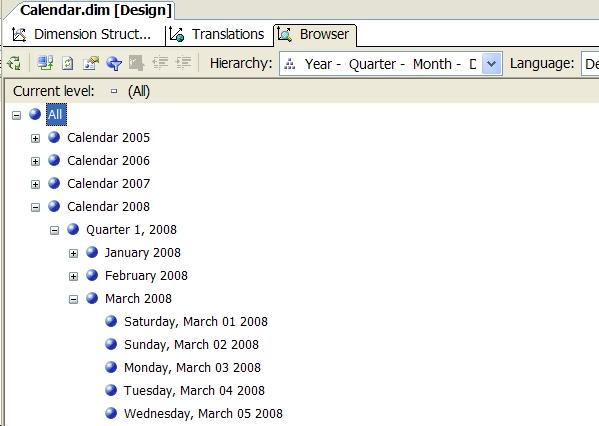
Click on the Browser tab for Calendar.dim to view the actual data in the dimension.  This step shows the hierarchies in the time dimension, based on the time periods selected in the Cube Wizard.  The hierarchy  shown below allows us to query at the year, quarter, and month levels. 

browser

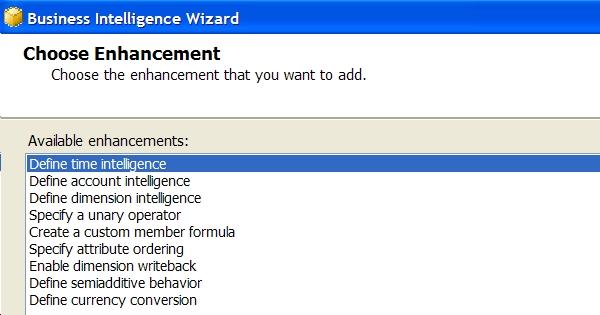
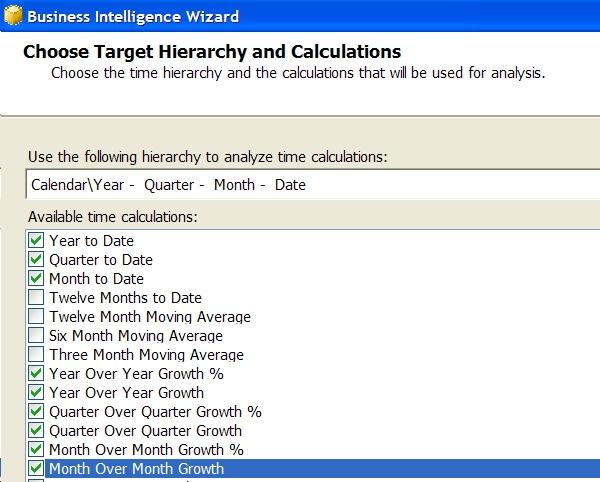
At this point we have created a cube with a properly configured time dimension.  The next step is to add the built-in Time Intelligence which allows us to specify the types of time slicing we want to use in our queries.  Click on the MSSQLTips cube in Solution Explorer then click Cube on the top-level menu and Add Business Intelligence to launch the Business Intelligence Wizard.  Select Define time intelligence from the list of available enhancements.  The prerequisites for adding Time Intelligence are a time dimension with one or more hierarchies that is linked to one or more measures.

define time intelligence

Click on the Available time calculations that you want to add to the cube.  A brief description of each is displayed as you click or scroll through the list. 

choose target

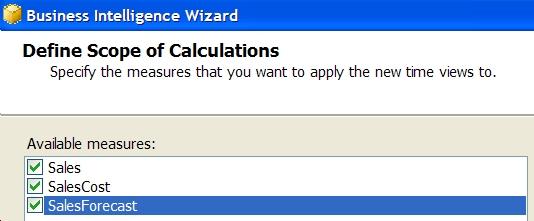
Select one or more measures to implement the calculations you selected in the previous dialog.  This is the final step in the wizard.

define scope of calculations

The Business Intelligence Wizard creates a number of calculated members in the cube which you can view on the Calculations tab of the cube.  The wizard creates an additional hierarchy in the Calendar dimension.  The hierarchy name is derived from the hierarchy that you pick in the Choose Target Hierarchy and Calculations step of the wizard.  In this example the hierarchy name is Year - Quarter - Month - Date Calendar Calculations.  Right click the MSSQLTips cube in the Solution Explorer and select Process to update the cube with the Time Intelligence calculations.

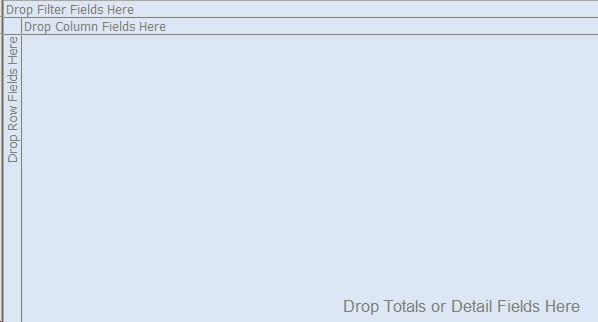
Our final step is to browse the cube and take advantage of the Time Intelligence to perform some queries.  Double click the MSSQLTips cube in the Solution Explorer to display the cube designer then click the Browser tab.  The Browser tab user interface is essentially the pivot table that you are familiar with from Excel or the Office Web Components.  Note the instructions on where to drop column fields to browse the cube.

drop filter

Perform the following steps to see an example of the Time Intelligence calculations:

  • Drag and drop Sales and SalesCost from Measures onto the Drop Totals or Detail Fields here area
  • Drag and drop Year from the Calendar dimension onto the Drop Row Fields here area
  • Drag and drop Year - Quarter - Month - Date Calendar Calculations from the Calendar dimension onto the Drop Column Fields here area
  • Click Year - Quarter - Month - Date Calendar Calculations in the Drop Column Fields here area and click Current Calendar, Year over Year Growth % and Year Over Year Growth
  • Click Year on the Drop Row Fields here area and click the years 2006, 2007 and 2008

You should now have a pivot table that looks like this:

date calendar calculations

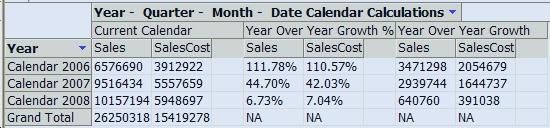
The above pivot table shows Sales and SalesCost for the years 2006 through 2008, as well as the Year Over Year Growth % and Year Over Year Growth (in dollars).  The sample data used to populate the cube was a simple query that extracts data from the sample AdventureWorksDW database that comes with SQL Server 2005. 

Next Steps
  • Download a copy of the sample SSAS project here to experiment with the built-in Time Intelligence features in SSAS.  Note that the project assumes you have an instance of SQL Server and Analysis Services running locally.  Unzip the files into the folder "C:\MSSQLTips" to minimize changes to get the sample to run and follow the instructions in the README.txt file.
  • While the Time Intelligence Wizard provides many calculation options, you may come up with others and you will have to implement these yourself.  You can follow the pattern of the calculations created by the built-in Time Intelligence to do this.
  • Before you run the Time Intelligence Wizard make sure that you have all of your measures defined in the cube.  Each time you run the wizard it creates a whole new hierarchy in the time dimension for the calculations.  You can manually edit the generated calculations from the Calculations tab in the cube designer if necessary.


sql server categories

sql server webinars

subscribe to mssqltips

sql server tutorials

sql server white papers

next tip


About the author
MSSQLTips author Ray Barley Ray Barley is a Principal Architect at IT Resource Partners and a MSSQLTips.com BI Expert.

This author pledges the content of this article is based on professional experience and not AI generated.

View all my tips


Comments For This Article


Tuesday, June 2, 2015 - 10:23:08 AM - Bhuvan Vemuri Back To Top (37362)

Thanks for the detailed explanation. It's really helpful! Saved lot of time.


Thursday, June 12, 2014 - 4:56:19 AM - JChoy Back To Top (32208)

Hi,

thanks for the nice articule. I am concentrating now in the ETL process for loading figures to the FACT table.

My issue is that I am collecting information from server loacated located in different time zones. Also, I need to considere the time change during the year.

The time change 2 times in the UK. For example, 30 of March 2014 and Oct 26 2014. My fact table is reflecting info of usage of licences for some 3D applications and the ETL process is executed every 5 minutes.

Main Issue: Reflecting opening and closing time of licence sessions. For example, A licence is opened at 01:59 am, then time is turned back to 01:00 am again and the user close the licence sesion 10 minutes later. So it will show something that the closing time is in the past and the time usage in negative.......... I know, wrong design or they did not think about it.

How could I adapt my DimDate dimension or the ETL process to deal with this events ??????

Many Thanks


Wednesday, November 7, 2012 - 12:34:22 PM - DaRock Back To Top (20247)

Ray, you're da bomb!


Wednesday, June 27, 2012 - 12:42:19 PM - Ray Barley Back To Top (18226)

There are a couple of ways. First you need to have your time dimension created correctly; i.e. dimension type needs to be Time and each attribute's Type must be set; e.g. Years, Months, etc.  You will find that starting out with the approach in this tip is the easiest way but you are free to roll your own.  At a minimum you need to browse your dimension and make sure everything is okay in terms of your hierarchies; i.e. days rollup to months, months rollup to quarters, quarters roll up to years, etc.

In the tip I show adding the Time intelligence.  This is one way of getting what you need and I would say it's the easiest.  At a minimum do this as a test then you can reference the cube calculations to see how each of the calculations is done in MDX.

Another approach is to create individual calculated measures; e.g. Sales YTD would be AGGREGATE ( YTD ( [Time].[Calendar].CurrentMember ), Measures.[Sales] )  

Still another approach is similar to the time intelligence but puts the calculations in a different dimension than the time dimension.  Take a look at this example of how to do that (also a good source for the MDX expressions that you need):

http://www.obs3.com/pdf/A%20Different%20Approach%20to%20Time%20Calculations%20in%20SSAS.pdf


Wednesday, June 27, 2012 - 10:01:37 AM - VIshva Ratna Back To Top (18224)


Hi Ray ,

Its indeed a very good artical but still i didn't get what i was looking for . I want to add some TO-DATE features in my cube so that i could analyse severals measure's data according to the fields Like PTD, YTD, QTD etc.   Can You tell me how can i add these PTD , YTD etc fields because these fields were not there in the time intelligence options.

one more thing i didn't created my Time Dimention table with the help of the wizard rather i just created with the help of a script (thought may be this can have impact on the time intelligence). but i can see and apply thaose time intelligence fields in my dimension.  


thanks in advance


Tuesday, May 29, 2012 - 2:09:27 PM - Raymond Barley Back To Top (17705)

create an Import Analysis Services project in Business Intelligence Developer Studio (BIDS).  This allows you to create the SSAS project from an existing SSAS database.   Then look at the .cube file in the project to see the MDX.


Tuesday, May 29, 2012 - 6:13:00 AM - Ravi Kumar V Back To Top (17695)

Hi Ray,

It is indeed very helpful article. Thank you for sharing. 

I have one question which I am searching answer since long. How can we identify the some intellegence is added to the CUBE?

Thank you in advance.


Friday, May 25, 2012 - 11:52:55 AM - Ray Barley Back To Top (17662)

You can see the generated MDX by looking at the MSSQLTips.cube file in the sample project.


Friday, May 25, 2012 - 11:01:48 AM - venky Back To Top (17661)

Can we automatically generate the MDX code using SSAS Browser Tab. Please help me.


Wednesday, October 1, 2008 - 4:44:38 AM - JohnCHill Back To Top (1897)

Great, thank you!


John


Tuesday, September 30, 2008 - 2:24:17 PM - raybarley Back To Top (1894)
The tip doesn't explicitly say that you have to populate the schema that is generated but as you have pointed out, you do. There is a script file in the download which will copy some data out of the AdventureWorksDW database into the mssqltips_dw database. The script file is populate_fact_sales.sql.

Tuesday, September 30, 2008 - 10:13:30 AM - JohnCHill Back To Top (1892)

I guess I am misssing something because, how can your table be populated if you created it without a datasource? When I follow the directions, I get the Calendar that is populated with dates but the fact table is empty.

Am I missing a step?

 Thank you.

 John


Sunday, July 20, 2008 - 5:25:15 AM - raybarley Back To Top (1468)

 You could add a Named Calculation to the fact table in the Data Source View to truncate the time portion of the date and expose that as a new column that you can use as a foreigh key to the time dimension.

If your fact table is in SQL Server you could use an expression like this for the named calculation:

convert(datetime, convert(varchar(10), <your datetime column goes here>, 120)) 


Saturday, July 19, 2008 - 11:09:56 PM - Riaz Back To Top (1466)

I have added a Dimension which type is TIME, when I am trying it to add in my data source view, I am unable to find the relationship key, because in my Fact Table BillDate format is dd/mm/yy hh:mm:ss and in the Calendar Dimension it is only dd/mm/yyyy. How can I create the KEY is Fact Table.

Time Type Dimension is not in the CUBE thats why this Time Intelligence Wizard is not working here. 


Saturday, July 19, 2008 - 4:14:48 PM - raybarley Back To Top (1462)
Did you add the time dimension to the Data Source View then add the foreign key relationships between the fact tables and time dimension?  Then you add the time dimension to the cube.

The article was written based on creating a cube without a data source.  In order to add time intelligence to an existing cube, you open the project, select the cube, click the Cube menu, then select Add Business Intelligence which will launch the Business Intelligence Wizard.  Select Define Time Intelligence and complete the wizard.

It would probably be worth following the steps in the article and setting up the time intelligence in a test cube to get familiar with all of the settings.


Saturday, July 19, 2008 - 5:40:12 AM - Riaz Back To Top (1461)

I have tried this many times but still not working, I just tell you my situation then please suggest me what to do.

I have Generated Cube with OLTP Data Source already in that cube i have one Fact Table ( Billing ) and two Dimensional Table ( Customer And Office Location ) now i want to apply built in time intelligence in that cube. I have tried your solution, it is creating time dimension table in OLTP database and creating one Calendar Dimension as well but i m unable to link it with Billing Fact Table and unable to Define Time Intelligence in my CUBE.


Tuesday, July 1, 2008 - 8:12:29 AM - rachaeland Back To Top (1334)

Thanks for the info.  Any suggestions on the problem I'm trying to solve?


Tuesday, July 1, 2008 - 3:56:02 AM - raybarley Back To Top (1330)

Portland SQL Server User Group: http://www.pdxvbug.com/pdxuser.asp

I think

MDX Solutions: With Microsoft SQL Server Analysis Services 2005 and Hyperion Essbase

is a good book

http://www.amazon.com/MDX-Solutions-Microsoft-Analysis-Services/dp/0471748080


Monday, June 30, 2008 - 4:00:05 PM - rachaeland Back To Top (1324)

This worked well.  Thanks.  However, I have an additional need using Xcel 2007 to do the following shown below for the most recent quarter with data (I have a column on my date dimension that can identify this if necessary) without having to add the date dimension.  I would like to add calcuations to the cube since this is information that is used by alot of production reports and reports that will be built by end-users using Xcel 2007.  Is this possible?  I'm really new to this so excuse my ignorance.  Also, does anyone know of a good book about MDX and Analysis Services that would have examples.  I would also like to find a user group in the Portland Oregon area.

Measure   Curr Value   Prior Qtr Value  Prior Qtr % Chg

Clm Cnt

Clm Pd

Avg Pd

etc.


Monday, June 23, 2008 - 2:02:50 PM - raybarley Back To Top (1235)

There is some sort of limitation with Excel which doesn't allow this.  You can take a look at this blog entry and see if this work around would be acceptable: http://sqlblog.com/blogs/marco_russo/archive/2007/09/02/datetool-dimension-an-alternative-time-intelligence-implementation.aspx

If you're considering Performance Point, you could use the Analytic Grid report.  It doesn't have the limitation that you have found in Excel. 


Monday, June 23, 2008 - 1:53:50 PM - rachaeland Back To Top (1234)

Thanks.  I can now bring them in but I have another problem.  It brings in all the different calcuations but I only want to show to the quarter over quarter growth %.  What I really want to do is pick two consecutive quarters and be able to show several measures for the two quarters and then shower the quarter over quarter growth % for the two quarters (only show it once).  Any ideas of how I can do this?


Monday, June 23, 2008 - 11:05:18 AM - raybarley Back To Top (1232)

 Check your PivotTable Options and make sure Show calculated members from OLAP server is checked; by default it is not checked.  Once checked you should see the calculated members.


Monday, June 23, 2008 - 10:30:15 AM - rachaeland Back To Top (1231)

I tried this out and it works fine when I browse using the Business Intelligence Development Studio or Management Studio but the percent growth, etc calcuations don't show up when I try to access the cube using Excel 2007.  How can I make them show up?


get free sql tips
agree to terms