By: Ashish Kumar Mehta | Comments (4) | Related: > SQL Server Agent
Problem
Finding a good reporting mechanism for your SQL Server Agent can be tedious and time consuming. You can either write your own reporting application or choose a third-party solution. You may also have to install an instance of Reporting Services in your environment, depending on the needs of the application. SQL Server 2005 includes a number of built-in reports to assist you in troubleshooting and measuring performance. In this tip I will cover the Built in SQL Server Performance Reports related to SQL Server Agent within SQL Server 2005.
Solution
As part of the installation of SQL Server 2005 a number of performance related reports are installed. To get to these reports open the SQL Server Management Studio (SSMS) and connect to a SQL Server 2005 instance. If you don't have an instance of Reporting Services installed then the icon will be disabled. You can download SQL Server 2005 Performance Dashboard Reports which can be used to monitor and resolve performance problems on your SQL Server 2005 database server from the following link. To know more about Built-In Database Engine Performance Reports in SQL Server 2005 you can check the following link.
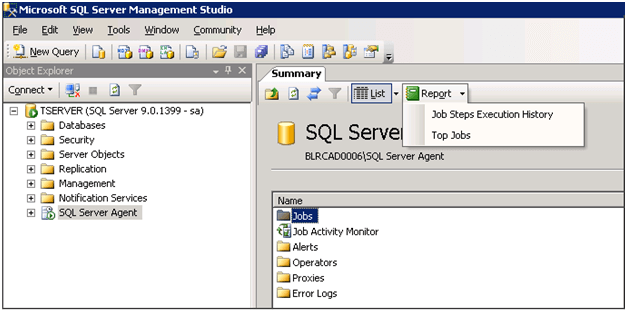
Once connected to the SQL Server Database Engine in SQL Server 2005, click on the SQL Server Agent and then the Reports button in the Summary section as shown in the snippet below.

There are basically two built in SQL Server Agent reports, the name and usage of their reports are mentioned in the below table.
| Report name | Description |
| Top Steps Execution History | This report provides details on the success and failure of execution of individual job steps over the last 7 days as recorded in MSDB. |
| Top Jobs | This report identified individual jobs that may be of interest for a variety of reasons. |
Lets us go through each of these reports in details to understand how they can be used.
Job Steps Execution History Report
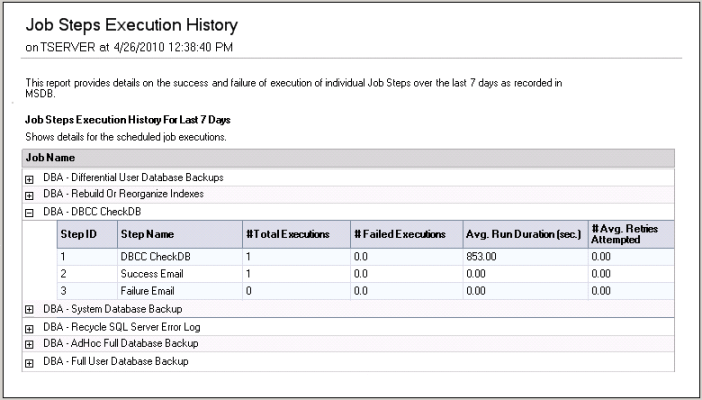
You can select Top Steps Execution History report from the summary section to quickly understand how many total executions the job had in the last 7 days, number of times the job failed, the average run time durations, retry attempts etc. This is an easy way to understand how each job is performing in each instance of SQL Server.

Top Jobs Report
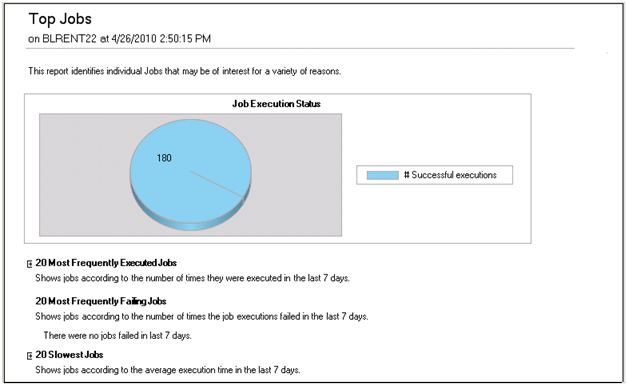
You can select Top Jobs report from the summary section to quickly understand overall job execution status in an instance of SQL Server 2005. In this report you can also check the 20 most frequently executed jobs, 20 most frequently failing jobs and the 20 slowest jobs.

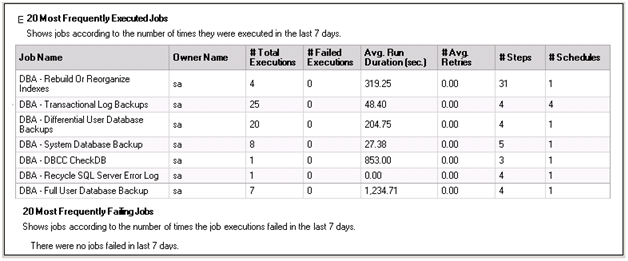
You can expand the 20 Most Frequently Executed Jobs and the 20 Most Frequently Failing Jobs to get the complete list of frequently executing and failing jobs respectively as shown in the snippet below.

Moreover, you can expand the 20 Slowest Jobs in the Top Jobs report to get the list of the slowest jobs as shown in the snippet below.

Next Steps
- Investigate the new built-in reports in SQL Server 2005 and incorporate them into your troubleshooting.
- Read all my previous tips.
About the author
 Ashish Kumar Mehta has been contributing to the MSSQLTips.com community since 2009 with over 60 tips.
This author pledges the content of this article is based on professional experience and not AI generated.
View all my tips


