By: Tim Ford | Comments (2) | Related: > Dynamic Management Views and Functions
Problem
I'm starting to get interested with the Dynamic Management Views in Microsoft SQL Server. What kind of information can I collect from the sys.dm_os_sys_info DMV?
Solution
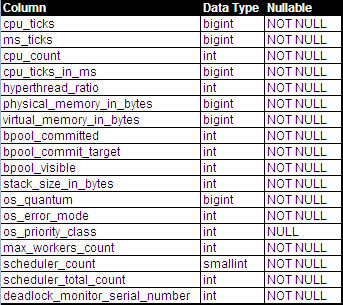
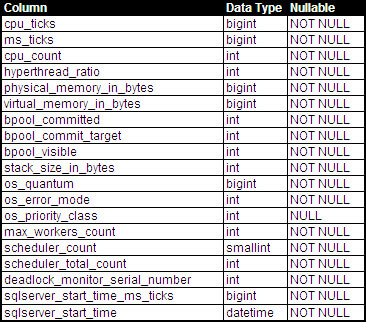
That DMV is a great jumping-off point, because we'll be able to look at a few different uses for the columns exposed in that view and also look at how the DMVs have the possibility of changing as new releases of SQL Server occur. Before diving right into the different queries you can run against sys.dm_os_sys_info I want to show you what the schema looks like for that DMV in SQL Server 2005 and SQL Server 2008. Just so you're aware that these objects change and evolve over time.
SQL Server 2005 Schema

SQL Server 2008 Schema

As you may notice, there was a schema change from SQL Server 2005 to SQL Server 2008. The first, cpu_ticks_in_ms was eliminated after SQL Server 2005. Also, sqlserver_start_time_ms_ticks and sqlserver_start_time were added in the release of SQL Server 2008 (making determining the start time for the SQL services far easier than in SQL Server 2005.) The cpu_ticks_in_ms was eliminated by Microsoft over concerns that it was not calculating accurately. This figure can still be obtained by use of the following function and works in both SQL Server 2005 and later:
[cpu_ticks] / [ms_ticks] The addition of sql_server_start_time in SQL Server 2008 allows for the simplification in a query that allows for the comparison between server, and SQL start times in one of the queries I'll be presenting later in this tip. Speaking of scripts. It's time to see what questions this Dynamic Management View helps to answer for us.
CPU - Based Information
What are the number of physical CPUs and core (aka virtual CPU) count for the server the SQL instance is hosted on?
SELECT cpu_count AS virtual_cpu_count,
 cpu_count/hyperthread_ratio AS physical_cpu_count
FROM sys.[dm_os_sys_info];
What does the current CPU utilization look like?
Robert Pearl, in a 2009 article on SQL Server Central had provided a query that answers this specific question when examining the schema changes in sys.dm_sys_info between SQL Server 2005 and 2008. My query is so similar to his that I didn't feel comfortable providing it in this article without raising the spectre of plagiarism. Instead I'll point you to his solution here and ask you to check out his article as it goes beyond this query. Below is what the output of his query looks like against my test server:
![]()
Personally I am not a fan of returning more information than is necessary, so I would advocate not returning the record_id. What I like about this query is that a DBA can pull this information easily, without the need of remoting into the server and pulling up the Task Manager.
What about workers, schedulers on the instance?
When a user connects to SQL via some application or program they will eventually submit a command to SQL Server to do something. This "something" may be to create a table, insert a record, or select a range of records from a table or set of tables. This "something" has a name: a Batch. The database engine will assign the batch to a session and may, if conducive to the operation of fulfilling the batch's mandate, split the batch up into one or more tasks that will be assigned to a worker (thread) to run on a SQL scheduler. The number of workers is controlled by the worker pool, the size of which is controlled by SQL Server via the max worker threads setting. When set to 0 the count of workers is managed by SQL Server and is based upon whether the instance is running on a 32 or 64-bit platform and also on the count of CPUs. There is a table associated with these fixed values in Books Online available from Microsoft. We can obtain an insight into the settings for max worker count by querying sys.dm_os_sys_info and comparing it to that chart on Books Online.
The following query and two result sets were obtained from two identical instances running on the same SQL 2005 Enterprise Edition 64 bit cluster in my environment. You'll notice that though the servers are identical, there are differences in their max_workers_count and total scheduler count. This is because the setting for the first instance shown below was left at max workers count = 0 whereas the second instance had its setting for max workers count at 128.
SELECT
 cpu_count ,
 [max_workers_count],
 [scheduler_count],
 [scheduler_total_count]
FROM sys.[dm_os_sys_info] dosi
![]()
![]()
The values for scheduler_count and scheduler_total_count are associated with those schedulers able to service user threads for the instance, and total schedulers for all SQL Server threads including those not accessible to user threads.
Uptime Information
When was the server last restarted?
SELECT
 [ms_ticks] AS ms_since_restart,
 [ms_ticks]/1000 AS seconds_since_restart,
 CAST([ms_ticks]/1000/60.0 AS DECIMAL(15,2)) AS minutes_since_restart,
 CAST([ms_ticks]/1000/60/60.0 AS DECIMAL(15,2)) AS hours_since_restart,
 CAST([ms_ticks]/1000/60/60/24.0 AS DECIMAL(15,2)) AS days_since_restart,
 DATEADD(s,((-1)*([ms_ticks]/1000)),GETDATE()) AS time_of_last_restart
FROM sys.[dm_os_sys_info];
![]()
How does the server restart time compare to the SQL Server service start time? (SQL 2005 and later)
We can analyze the difference between server and SQL Server service start time by looking at when the create date of tempdb when compared to the information stored in sys.dm_os_sys_info. However, as I presented recently on my blog, you can't rely on the create_date being accurate in sys.databases when Daylight Savings Time is a factor. Only the sqlserver_start_time column in sys.dm_os_sys_info provides an accurate accounting for the service start time when the switch between Daylight Standard and Daylight Savings Time occurs between the time of service restart and the current date. Unfortunately that column does not exist until SQL Server 2008. You'll also notice that there are slight differences between how the service start time is presented between options. I found this interesting, but could not find a decent explanation in any of my research.
SELECT
 DATEADD(s,((-1)*(DOSI.[ms_ticks]/1000)),GETDATE()) AS last_SERVER_restart,
 D.create_date,
 (DATEDIFF(s, DATEADD(s,((-1)*(DOSI.[ms_ticks]/1000)),GETDATE()), D.create_date)) AS recovery_time_seconds
FROM sys.[dm_os_sys_info] DOSI
 CROSS JOIN sys.[databases] D
WHERE D.[name] = 'tempdb';
![]()
SELECT
 DATEADD(s,((-1)*(DOSI.[ms_ticks]/1000)),GETDATE()) AS last_SERVER_restart,
 DOSI.sqlserver_start_time,
 (DATEDIFF(s, DATEADD(s,((-1)*(DOSI.[ms_ticks]/1000)),GETDATE()), DOSI.sqlserver_start_time)) AS recovery_time_seconds
FROM sys.[dm_os_sys_info] DOSI;
![]()
Memory Based Information
Determine when AWE is being used on a SQL instance
SQL Server can utilize Address Windowing Extensions to allocate additional RAM where it is hamstrung by edition limitations for use in the buffer cache. How this presents itself in sys.dm_os_sys_info is through the virtual_memory_in_bytes and bpool_visible columns. Below I present two screen shots of the same query. The query was run against a SQL 2005 Enterprise 64-bit instance and then against a SQL 2008 Standard Edition 32-bit instance:
SELECT
 [physical_memory_in_bytes]/1024/1024 AS [physical_memory_mb],
 [virtual_memory_in_bytes]/1024/1024 AS [virtual_memory_in_mb],
 [bpool_committed]*8/1024 AS [bpool_committed_mb],
 [bpool_commit_target]*8/1024 AS [bpool_commit_targt_mb],
 [bpool_visible]*8/1024 AS [bpool_visible_mb]
FROM sys.[dm_os_sys_info] dosi;
![]()
![]() Instance running with AWE
Instance running with AWE
The first instance (not running with AWE enabled) is a 64 bit install of SQL Server Enterprise Edition. It has 32,766 mb of physical memory, with the Maximum Server Memory (in MB) value set to 28,672 mb. As you can see, the committed physical RAM in the buffer pool (bpool_committed), the needed physical RAM in the buffer pool (bpool_commit_target), and the total size of all buffers in the buffer pool that can be directly addressed are all 28,672 mb. This all points to the instance NOT using AWE to address memory.
The second instance (running with AWE enabled) has 16,373 mb of physical RAM. In this case, the bpool_committed_mb is equal to my settings for Maximum Server Memory (in MB) of 13,312 mb, though it has to accomodate that setting by use of Address Windowing Extension to meet that target. You'll notice that the visible amount of buffer pool RAM is significantly smaller than committed or target buffer pool. This is a sign that AWE is enabled and it represents the size of the mapping window used via AWE to access physical memory for the buffer pool. In this case that value is 1,416 mb. This is the amount of memory that can be used by the plan cache, buffer pool, query optimizer, and query engine without the need to page out or use AWE. When finishing up this tip I was researching a better method for discovering when AWE is being used and ran across an interesting post by Slava Oks (blog). There is some crossover in what was discussed here, but it is a worthy read and I will only point you towards his take on determining when AWE is being used, so as not to deny him the page hit on his blog.
Overall, this DMV provides you with information related to CPU, uptime, and memory settings on your SQL Server instance.
Next Steps
- More tips from the author are available via this link.
- Other articles associated with Buffer Pool are also available on MSSQLTips.com.
About the author
 Tim Ford is a Senior Database Administrator with MindBody.
This author pledges the content of this article is based on professional experience and not AI generated.
View all my tips


