By: Aaron Bertrand | Comments | Related: > Resource Governor
Problem
Those of us using the Resource Governor, introduced in SQL Server 2008, often have to make arbitrary choices about how to limit specific resource pools or workload groups in terms of CPU, memory, parallelism and concurrency. In many cases we "set it and forget it," assuming that the choices we have made are correct; unless somebody complains, we have little motivation to revisit our configuration to determine if it should be adjusted in any way. Just because nobody is actively complaining does not necessarily mean that changes are not needed.
Solution
The Resource Governor includes a set of Dynamic Management Views (DMVs) that enable you to quickly spot potential problem areas in your Resource Governor (RG) configuration. The DMVs keep track of many RG-related statistics, such as total CPU usage and memory grant timeouts for a resource pool, and number of queued requests and suboptimal plan generations for a resource group.
Before we start examining these things, let's set up a fictitious example. Here we'll create a database called ResourceGovernor, and a couple of logins to use that database. Recall that Resource Governor limitations do not kick in unless there is significant contention, so the extra login is going to be doing some "busy work" so we can see RG in action.
USE [master];
GO

-- create two logins, one to simulate concurrency:
CREATE LOGIN default_pool_login
   WITH PASSWORD = 'foo', CHECK_POLICY = OFF;

CREATE LOGIN limited_pool_login
      WITH PASSWORD = 'foo', CHECK_POLICY = OFF;

-- create a separate database for testing:
IF DB_ID('ResourceGovernor') IS NULL
BEGIN
   CREATE DATABASE ResourceGovernor;
END
GO

USE ResourceGovernor;
GO

-- create db users tied to our logins:
CREATE USER default_pool_login FOR LOGIN default_pool_login;
CREATE USER limited_pool_login FOR LOGIN limited_pool_login;

-- give them the keys to the castle:
GRANT CONTROL ON SCHEMA::dbo TO default_pool_login;
GRANT CONTROL ON SCHEMA::dbo TO limited_pool_login;
GO
Now we can set up a severely limited resource pool and workload group. For the pool, we set the limit to 10 percent memory and 10 percent CPU; for the group, we set max degree of parallelism to 1, max request cpu time to 5 seconds, and max concurrent requests to 1. Finally, we create a classifier function that will correctly identify incoming sessions from login "limited_pool_login" and route them to this limited resource pool and workload group:
USE [master];
GO

-- resource pool with low memory / CPU thresholds:
CREATE RESOURCE POOL limited
WITH
(
   MAX_MEMORY_PERCENT = 10,
   MAX_CPU_PERCENT = 10
);

-- workload group with low maxdop / duration / concurrency:
CREATE WORKLOAD GROUP limited
WITH
(
   MAX_DOP = 1,
   REQUEST_MAX_CPU_TIME_SEC = 5,
   GROUP_MAX_REQUESTS = 1
)
USING limited;
GO

-- classifier function to route "limited_pool_login" to the limited pool:
CREATE FUNCTION dbo.TestClassifierFunction()
RETURNS SYSNAME
WITH SCHEMABINDING
AS
BEGIN
   RETURN (SELECT CASE SUSER_SNAME()
       WHEN N'limited_pool_login' THEN N'limited'
       ELSE N'default'
   END);
END;
GO
GRANT EXEC ON [dbo].[TestClassifierFunction] TO [Public];
GO

-- assign this function as the classifier function:
ALTER RESOURCE GOVERNOR WITH (CLASSIFIER_FUNCTION = dbo.TestClassifierFunction);
GO
ALTER RESOURCE GOVERNOR RECONFIGURE;
GO
Now that the login, pool, group and Resource Governor are configured, let's run some dummy load and observe what we see in the RG DMVs. Open two query windows as "default_pool_login" and connect to the ResourceGovernor database. Repeat this with two query windows as "limited_pool_login." Verify that Resource Governor has routed the requests correctly by running the following query in one window for each login:
SELECT group_id
   FROM sys.dm_exec_sessions
   WHERE session_id = @@SPID;
For the default_pool_login, the group_id returned should be 2 (the default group), and for the limited_pool_login, the group_id returned should be some number greater than 255 (it will be 256 unless you have already configured other workload groups on this instance).
Next, to generate some load, we want to make sure we do at least two things: (1) run a statement that takes longer than 5 seconds; and (2) try to run more than one query simultaneously from our limited group. So, run the following SELECT statement in all four query windows, starting with the two windows running under default_pool_login:
SELECT s1.*, s3.*
    FROM sys.columns AS s1
    CROSS JOIN sys.columns AS s2
    CROSS JOIN sys.columns AS s3
    CROSS JOIN sys.columns AS s4
    WHERE
        s2.name LIKE '%a%'
    ORDER BY
        s3.name DESC,
        s2.[object_id];
What you should observe is that the queries running under the default pool will start returning rows right away, but only one of the limited pool queries will be actively returning results - this is because the GROUP_MAX_REQUESTS setting of 1 only allows a single query to be running under that workload group at any time, so the other query has to wait until it is finished before it can start processing. You'll also notice that the query is allowed to proceed for more than 5 seconds in all cases - the REQUEST_MAX_CPU_TIME_SEC setting is only an event trigger, not an actual prevention mechanism.
Now, while those queries are busy churning your system, go back to your original query window (not using either of these two logins), connect to master, and run the following queries against the DMVs:
SELECT
   name,
   [start] = statistics_start_time,
   cpu = total_cpu_usage_ms,
   memgrant_timeouts = total_memgrant_timeout_count,
   out_of_mem = out_of_memory_count,     mem_waiters = memgrant_waiter_count
FROM
   sys.dm_resource_governor_resource_pools
WHERE
   pool_id > 1;

SELECT
   name,
   [start] = statistics_start_time,
   waiters = queued_request_count, -- or total_queued_request_count
   [cpu_violations] = total_cpu_limit_violation_count,
   subopt_plans = total_suboptimal_plan_generation_count,
   reduced_mem = total_reduced_memgrant_count
FROM
   sys.dm_resource_governor_workload_groups
WHERE
   group_id > 1;
Assuming this is a test system with not much else going on, you should see results something like this:
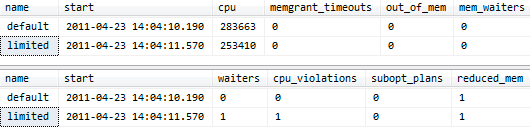
Now in this case, we haven't caused any memory issues with our specific query, but you should notice that as the queries continue running, the CPU figure for the default pool will increase at a faster rate than the limited pool, since the former isn't limited in any way, but the latter is intentionally constrained. You can also see that while the first limited query is running, the second is observed in the "waiters" column as a queued request. The cpu_violations column shows that we have had one query that has exceeded our CPU limit, and you can see that both pools have been subject to a reduced memory grant (this is likely due to my low max server memory setting for the instance).
For this specific query, the solution is simple: don't run big pointless queries within such an obviously limited workload group. But you can use the same types of queries against your own Resource Governor DMVs to determine whether you are inadvertently doing this very thing. Here is a quick summary of which columns to watch out for and why:
sys.dm_resource_governor_resource_pools
- total_cpu_usage_ms - it is tough to generalize
what to watch for in this figure independently, because it could be lower due
to the CPU constraint you've placed (MAX_CPU_PERCENT), or it could be higher
due to memory constraints at the pool level (MAX_MEMORY_PERCENT) or parallelism
constraints bubbling up from the workload group(s) in this pool (MAX_DOP) and
causing *more* CPU to be utilized.
- total_memgrant_timeout_count - this can tell
you if any requests in this pool have timed out while waiting for a query memory
grant. When this happens it can indicate that your pool may be too memory-constrained
(MAX_MEMORY_PERCENT).
- out_of_memory_count - similarly, this signifies
memory pressure on this pool, but in this case the count actually represents
queries that have failed due to insufficient memory. You may be able to alleviate
this by increasing the memory settings on the pool (MAX_MEMORY_PERCENT), but
it could be an instance-wide issue that requires more serious attention.
- memgrant_waiter_count - this is a real-time indicator
of how many requests in this pool are waiting on a memory grant. Again, if you
have too many requests that require too much memory, this indicates that the
memory constraint on the pool (MAX_MEMORY_PERCENT) may be too stringent. You
could reduce the number of concurrent queries possible down at the workload
group level (GROUP_MAX_REQUESTS), but this just means the users will be waiting
on something else.
- queued_request_count - this tells you how many
requests are currently waiting on other queries in the workload group. If this
number is consistently non-zero, you may consider increasing the GROUP_MAX_REQUESTS
setting for the group, or dividing your users into more groups with lower individual
resource constraints.
- total_queued_request_count - like queued_request_count,
this shows how many requests have waited due to workload group settings, but
since SQL Server was started, as opposed to current. Again, it can be an indicator
that your GROUP_MAX_REQUESTS setting is too low, or that there are too many
users in the workload group.
- total_cpu_limit_violation_counts - as described
above, this just means that this many queries went over your REQUEST_MAX_CPU_TIME_SEC
setting, which is just a threshold for you to monitor. If you expect this to
be 5 seconds and you are consistently exceeding this value, you may consider
adjusting the setting so that it stands out when query times are becoming a
more serious problem. Likewise if you are consistently seeing 0 here, your setting
may be so high that you are not going to suddenly notice when queries are taking
longer than normal (but still below your high threshold).
- total_suboptimal_plan_generation_count - this
number indicates how many times a better plan was ignored or not attempted to
be found due to workload group settings and/or memory pressure. This commonly
occurs when MAX_DOP for the group is set too low and a serial plan is chosen
over a (theoretically better) parallel plan, but can also indicate that the
resource pool has a low MAX_MEMORY_PERCENT setting.
- total_reduced_memgrant_count - this shows how
many times a query was denied the total amount of memory it expected to use,
which can often trickle down into more CPU being used and/or operations like
sorts spilling into tempdb. If you see this number often, you may consider adjusting
some of the other settings, such as MAX_MEMORY PERCENT at the "parent" resource
pool level, or perhaps it warrants investigating actual RAM configuration.
By running a few simple queries against DMVs, you can get a pretty quick sense of the effectiveness of your current Resource Governor configuration. Please keep in mind that DMVs do not persist data through service restarts, so do not jump to conclusions about data in the DMVs without also considering when SQL Server was started. This is what the statistics_start_time column is for - so you know exactly what kind of time frame the data involves.
Next Steps
- Test some queries against the Resource Governor DMVs, then set them up as a template or custom report in Management Studio, or a snippet in your favorite SSMS add-in.
- Periodically review the data shown by these DMVs, and make adjustments to your Resource Governor configuration when appropriate (see MSDN: ALTER RESOURCE GOVERNOR).
- Review the following tips and other resources:


About the author
 Aaron Bertrand (@AaronBertrand) is a passionate technologist with industry experience dating back to Classic ASP and SQL Server 6.5. He is editor-in-chief of the performance-related blog, SQLPerformance.com, and also blogs at sqlblog.org.
This author pledges the content of this article is based on professional experience and not AI generated.
View all my tips
